Geopolitics always sounds slow and grand until it hits the tape. Then it looks like gaps, spread blowouts, and a brief sense that familiar rules have taken the day off. This piece asks a narrow question with broad stakes. How do standard equity factors behave when geopolitical risk rises? Can we measure the link in a way that helps real portfolios?
We keep the lens number‑based. We use a standard risk index, a few clean tools, and known theory. No storytelling without a signal.
What we mean by “geopolitical events” and “factor performance”
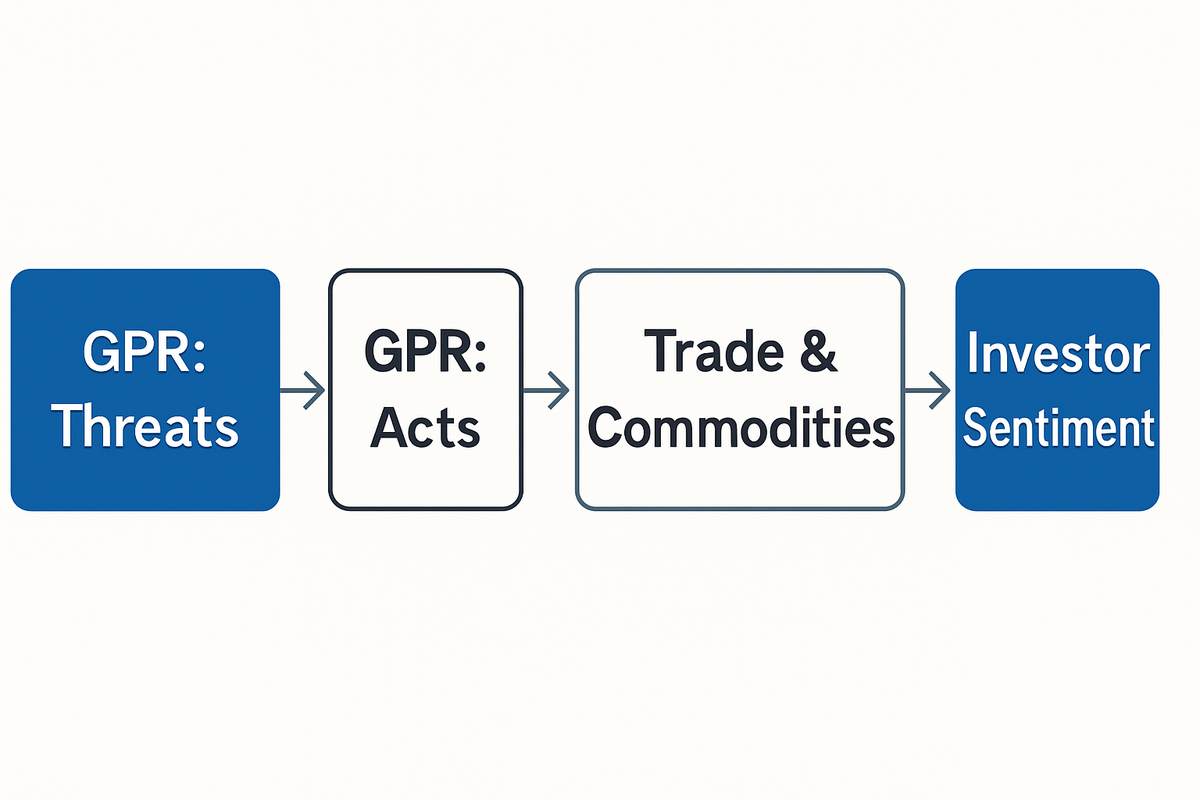
Geopolitical risk is not a hunch. It is a time series built from news that flags war, terror, and tensions with cross‑border reach. The benchmark is the Geopolitical Risk (GPR) index introduced by Caldara and Iacoviello.
It comes in daily and monthly form, with global and country slices.
The same research shows what a “shock” does. GPR spikes predict lower investment and employment and short‑lived stock drops, with the threat component doing much of the work. That is the shock we will use in event windows and as a regressor in factor tests.
Implementation details matter because the index is a construct, not a given. The working‑paper version from the Federal Reserve Board provides a method, audits, a longer sample, and an “acts versus threats” split with replication files. That helps in robustness tests and decomposition work IFDP working paper.
By “factor performance” we mean the returns and volatility of standard, investable equity styles. Value targets cheapness, momentum follows recent winners, and quality screens for strong balance sheets and profits. We use these three because they are widely implemented and well tracked.
Why this relationship matters now
Investor reviews highlight an awkward duo in today’s market. They are high dispersion and high volatility within factors, with leadership shifting in bursts. J.P. Morgan’s Factor Views describe periods where momentum leads and cross‑factor swings widen around macro and political events.
That is the kind of backdrop where a clean geopolitical signal can help.
BlackRock’s systematic teams argue against static allocations across cycles. They favor dynamic factor rotation based on macro, valuation and sentiment cues. They also note distinct behavior of value, momentum and quality during uncertainty spikes.
GPR‑based episodes are a natural input to such a rotation map.
Many allocators already rethink their regime signals because inflation, rates and policy now move together. For a broader frame on adapting models to macro shifts, see Enhancing Factor Models for Inflationary Environments: A Quantitative Approach.
If geopolitics feels like tail risk rather than a steady regime force, that is fair. Tail events still shape risk budgets and hedging rules. That is why we also connect these results to Tail Risk and the Impact of Geopolitical Tensions on Investment Portfolios.
Quantitative toolbox — event studies, multifactor regressions and spillover metrics
We use three tools that speak to different horizons. Event studies give a clean short‑window view around GPR spikes. Regressions fold the signal into conditional factor premia. Spillover metrics capture how stress in one factor bleeds into others.
Event studies start with the daily GPR series and define windows around large moves. The AER study documents short‑lived stock declines after GPR shocks. That sets prior expectations for factor behavior in close‑in windows the AER GPR paper.
In regressions, the GPR level or change is a variable alongside standard risk factors. This lets us test if value, momentum or quality carry an extra premium or penalty when geopolitical risk rises. The IFDP files make construction and checks straightforward.
To measure cross‑factor contagion, we use the Diebold–Yilmaz framework for return and volatility spillovers. It is based on generalized forecast‑error variance decompositions and shows bursts during crises. Those bursts are the stress feature we care about the Diebold–Yilmaz spillover index.
| Toolbox element | What it measures | When to use it |
|---|---|---|
| GPR event window | Short‑run factor reaction around a shock | Rapid diagnostics, trading halts, post‑mortems |
| Multifactor regression with GPR | Conditional factor premia under risk shifts | Allocation tilts, risk budgeting, scenario tests |
| Diebold–Yilmaz spillovers | Cross‑factor return/volatility transmission | Hedging overlays, rotation timing, stress drills |
Two simple rules help. Keep the event window tight to avoid macro drift. Segment GPR into threats and acts to see which component moves your factors.
Theoretical channels — how geopolitical shocks reprice factors
Why should factors care about geopolitics at all. Start with risk premia. A general equilibrium lens shows political uncertainty raises risk premia and lifts volatility. It also tends to increase cross‑asset correlation. The effects are stronger when the economy is weak. That is the core result of the Pástor and Veronesi framework.
Those mechanics show up in styles because factors are bundles of risks. Momentum is often long recent winners with embedded crowding risk. Value leans into cyclical and sometimes commodity‑linked cash flows. Quality often concentrates in stable balance sheets and safer margins.
Geopolitical shocks travel through trade, commodities and capital flows. The World Bank’s Global Economic Prospects outlines these channels and notes different impacts for commodity importers versus exporters. Those macro asymmetries map into factor spreads when sectors and countries shift together.
The GPR index itself has two faces: “Acts” capture realized conflict, while “threats” capture rising tensions in news. The IFDP decomposition shows why it is worth testing both. Threats can move prices before acts happen, and the AER study finds the threat component matters.
Empirical patterns seen in the literature — shocks, short‑run drops and spillover bursts
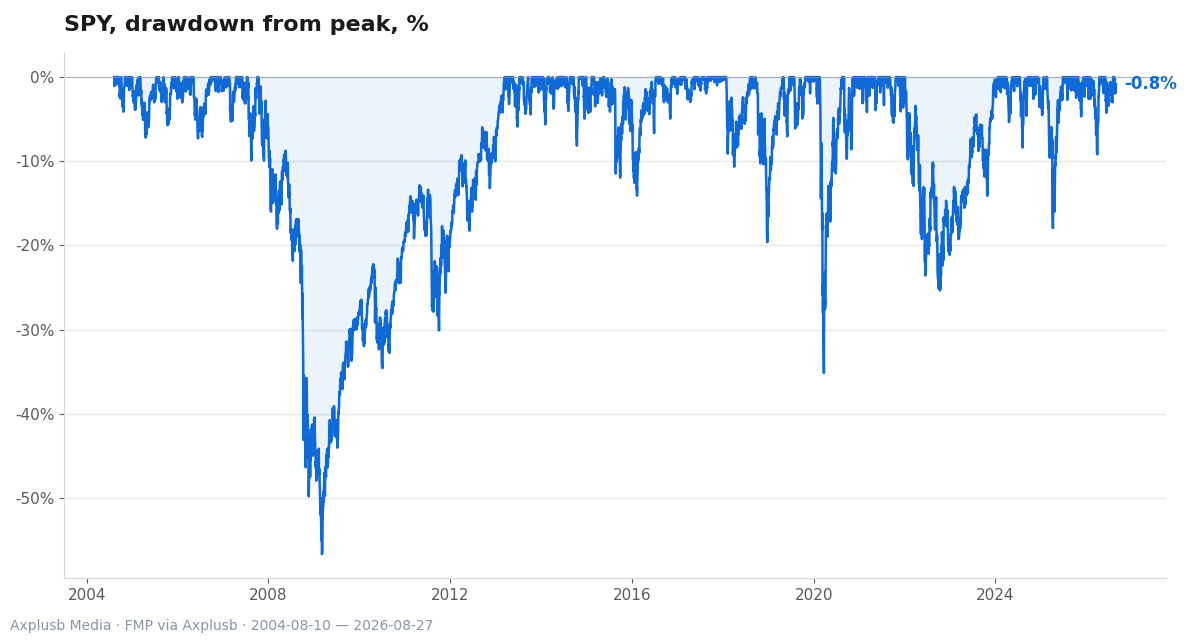
Three regularities anchor expectations. First, GPR shocks lead to short‑lived stock drops and softer real activity. That sets a base case for stress in pro‑cyclical factor legs and a possible bid for higher‑quality names Caldara and Iacoviello.
Second, volatility and return spillovers spike during crises. The Diebold–Yilmaz index captures how shocks in one portfolio raise forecast errors in others. That is a crisp way to quantify cross‑factor contagion Diebold and Yilmaz.
Third, institutional factor reviews have flagged higher factor volatility and dispersion around geopolitical episodes. J.P. Morgan’s commentary ties those swings to macro and policy surprises that cluster in such periods. That lines up with the theory of higher premia and correlations.
None of this says factors stop working. It says betas and covariances move in ways we can measure, and some style premia can fade or flip for a time. That is the edge a toolbox tries to capture.
How individual factors behave — value, momentum and quality during geopolitical stress
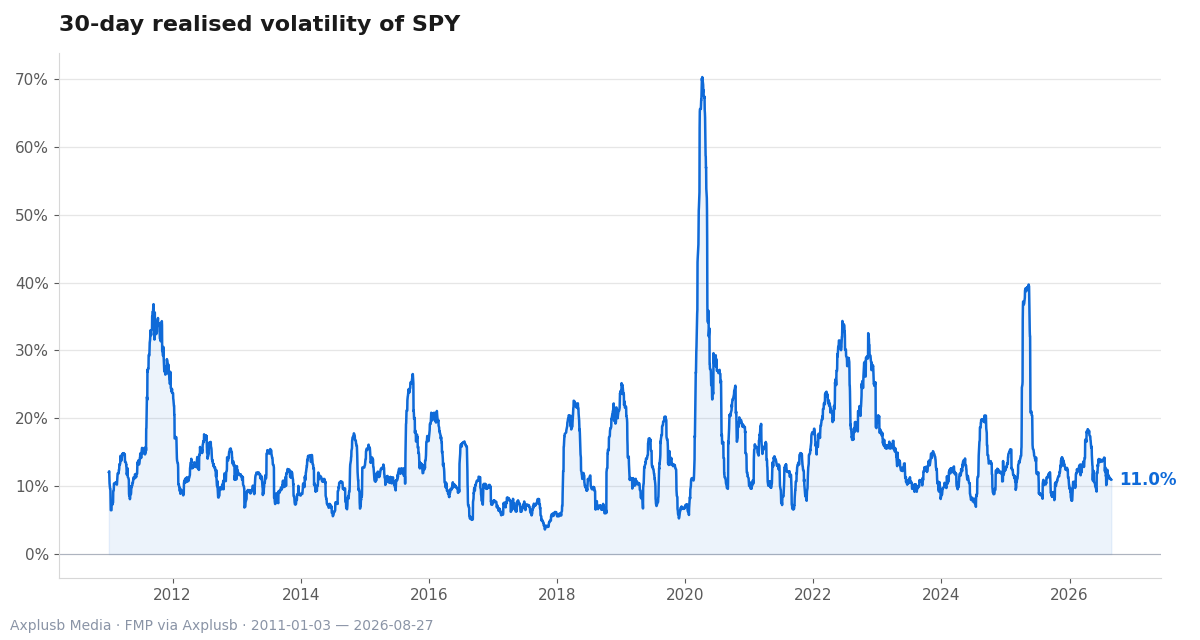
Start with momentum. Institutional reviews in 2026 note momentum leadership in stretches of the year, with stronger swings around macro and political news. Momentum can respond fast to regime signals. That helps in rapid rotations but brings whipsaw risk when shocks fade.
Value is tied to the cycle and sometimes to commodities and trade. When geopolitics lifts energy and supply uncertainty, relative value can shift with terms of trade. The World Bank’s view on commodity channels helps read value’s cross‑country legs in those episodes.
Quality often shows resilience when uncertainty rises. Strong balance sheets and stable profits can earn a bid as risk premia rise and correlations climb. BlackRock’s rotation templates place quality as a core ballast during uncertainty spikes. This fits the theoretical channel.
The shared point is heterogeneity: different factors react in different ways and on different clocks. That is why dynamic rotation beats static weights in the face of geopolitical risk. It is also why we pair rotation with spillover and event‑study diagnostics.
Robustness, data construction and practical caveats
A clean build reduces false signals. Use the IFDP replication files for GPR. Stick with both global and country indices where relevant, and keep the “acts versus threats” split in your tests the IFDP methodology and files.
Mind the horizon. The AER study documents that equity drops after GPR spikes are short‑lived at the index level. That means long‑window averages can dilute the effect AER evidence on short‑lived drops.
State dependence matters. The Pástor and Veronesi model shows uncertainty effects get larger in weak economic conditions. Conditioning on macro state can improve your inference. A blind rule that ignores the cycle can explain little and trade too much.
Finally, measure interaction, not just direction. The Diebold–Yilmaz index quantifies how stress in one factor spills to others. If spillovers jump, hedges tied to a single factor may not work as planned the spillover framework.
Counterarguments and alternative interpretations
One view is that geopolitics is noise for factor investing because many effects fade. The AER work does show short‑lived stock drops. That suggests caution before building long‑horizon tilts on short‑run shocks. That is a fair check on over‑engineering.
Another point is heterogeneity across countries. The World Bank notes that commodity importers and exporters feel shocks differently. That can flip winners and losers across value and quality baskets with different sector weights. Simple global averages hide that spread.
A third angle is state dependence: if uncertainty hits when growth is solid, the Pástor and Veronesi channel can be muted. In weak conditions it can amplify. Ex‑ante macro filters help explain why the same headline lands differently across time.
Institutional reviews also warn against overfitting rotation rules to a short sample of events. J.P. Morgan points to elevated dispersion and momentum leadership, yet those could reverse if macro stabilizes. Parsimony beats the urge to micromanage every headline.
Practical conclusions — implementation recipes, indicators and further reading
Here is a simple way to put this to work. Build a GPR shock monitor from the IFDP files and set percentile thresholds for event windows. Then test factor returns and volatilities in tight windows before and after the spike. Confirm that short‑run effects align with your priors.
Next, add a regression layer with GPR as a regressor on factor returns, conditioned on macro state. This tells you if any factor carries a GPR‑linked premium or penalty and whether it depends on growth conditions. Keep the “acts versus threats” split to see what actually moves prices.
Finally, run a Diebold–Yilmaz spillover dashboard for your chosen factor set. Watch for bursts in return and volatility spillovers when GPR spikes, and tie rotation or hedging triggers to those bursts. That improves timing and reduces over‑trading on weak signals.
Two pieces help with implementation. For hedging overlays against sudden shocks, see Hedging Against Geopolitical Events: Effective Techniques for Minimizing Portfolio Risk.
Two short rules close the loop: combine a GPR signal with a spillover gauge before rotating factors, and benchmark your rules against institutional templates rather than starting from scratch. Then keep the code simple and the test windows honest.
Check how disciplined your portfolio really is. Run a one‑page GPR shock audit on your factor book this quarter.
Related reading
- Tail Risk and the Impact of Geopolitical Tensions on Investment Portfolios
- Hedging Against Geopolitical Events: Effective Techniques for Minimizing Portfolio Risk
- Enhancing Factor Models for Inflationary Environments: A Quantitative Approach
- Exploring the Evolving Landscape of Factor Models and Their Performance in Today’s Markets