Geopolitics changes not only the path of markets, but also the shape of their risks. The risk that matters most is not a small drift in average returns. It is the chance of a large, sudden loss when events jump from rhetoric to action.
Tail risk in this setting is not a metaphor. It is the measurable rise in the odds of bad outcomes when geopolitical stress shifts from background noise to a live event.
What do we mean by “tail risk” in a geopolitical context?
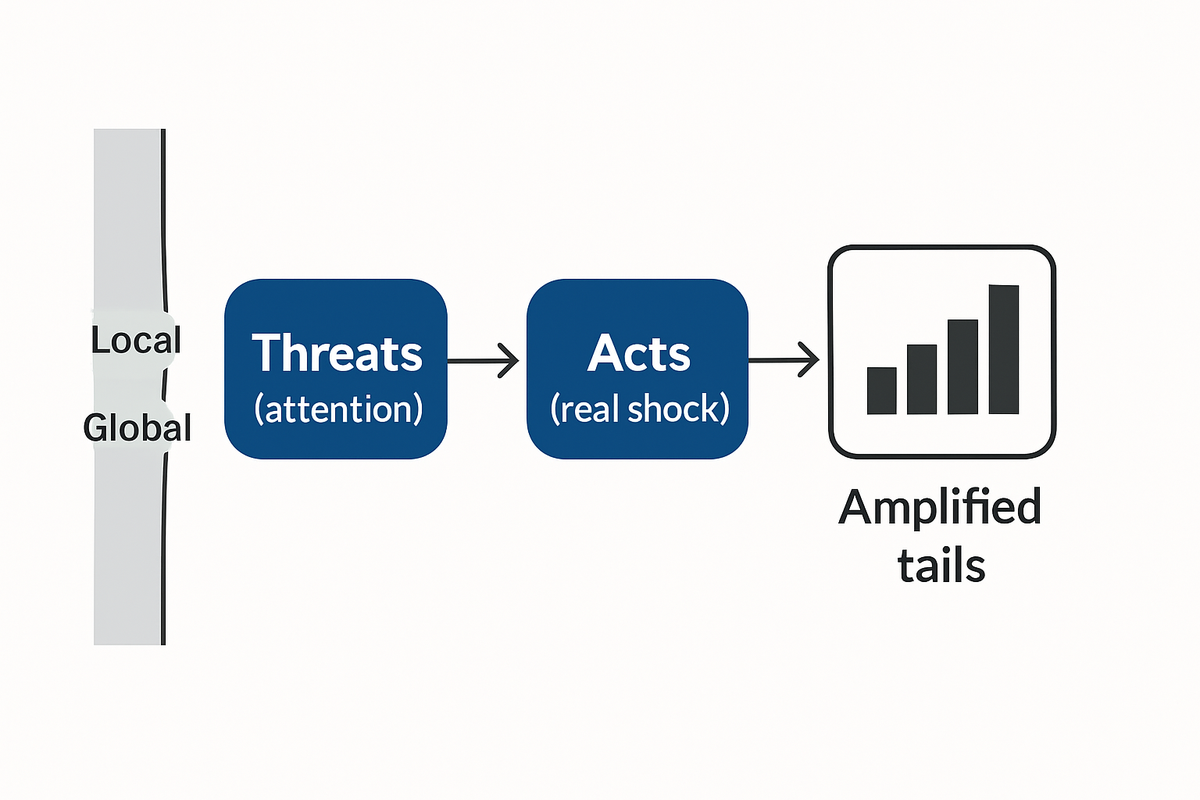
Tail risk is the probability and size of outcomes that live in the far left of a portfolio’s return distribution. In practical terms, it is the 10th percentile and worse, where funding plans break and governance gets tested. The focus belongs on quantiles, not means, because averages hide the asymmetry that shocks create.
In geopolitics, the distinction between “acts” and “threats” is central. “Acts” are kinetic or sanctioned events that change cash flows and risk premia. “Threats” are warnings, postures or negotiations that move attention without immediate disruption. The evidence shows that acts hit harder than threats at the same headline risk level.
The global geopolitical risk index, often used in empirical work, captures both regimes and their dynamics. When this index rises, the distribution of equity returns shifts, with the left tail getting fatter. That is the part that sinks plans built on steady volatility.
Geopolitical tail risk also travels across borders. It does not stop at the asset or country directly in the news. Tail shocks create asymmetric international effects, which raise the value of risk sharing while shifting terms between “safer” and “riskier” markets, as shown in BIS Working Paper 958.
Why geopolitical tail risk matters now — the 2025–26 inflection
The market tape of 2025–26 carried several episodes of abrupt repricing as tensions rose. Commodities swung, FX pairs gapped, yields reset and credit spreads widened, then tightened in bursts. Volatility came in clusters rather than as a steady hum.
At the index level, investors have been living with two‑sided tail exposure. The left tail has been tied to energy supply and inflation scares. The right tail has been tied to the strength of technology leaders and the AI trade, alongside options markets that actively reprice hedges in real time, as noted by Bloomberg Markets.
Recent global assessments described market recalibration under shifting currents and recurring bursts of stress. The common thread is that geopolitical triggers amplified the speed and depth of moves across assets. This is the regime in which tail discipline earns its keep.
If your process assumes mild noise and quick mean reversion, it is time to adjust. Scenarios need to reflect tails that arrive in waves. Portfolio hedges need to address both sides of the distribution, with costs understood and contained.
How geopolitical shocks fatten and skew portfolio tails (mechanisms and magnitudes)
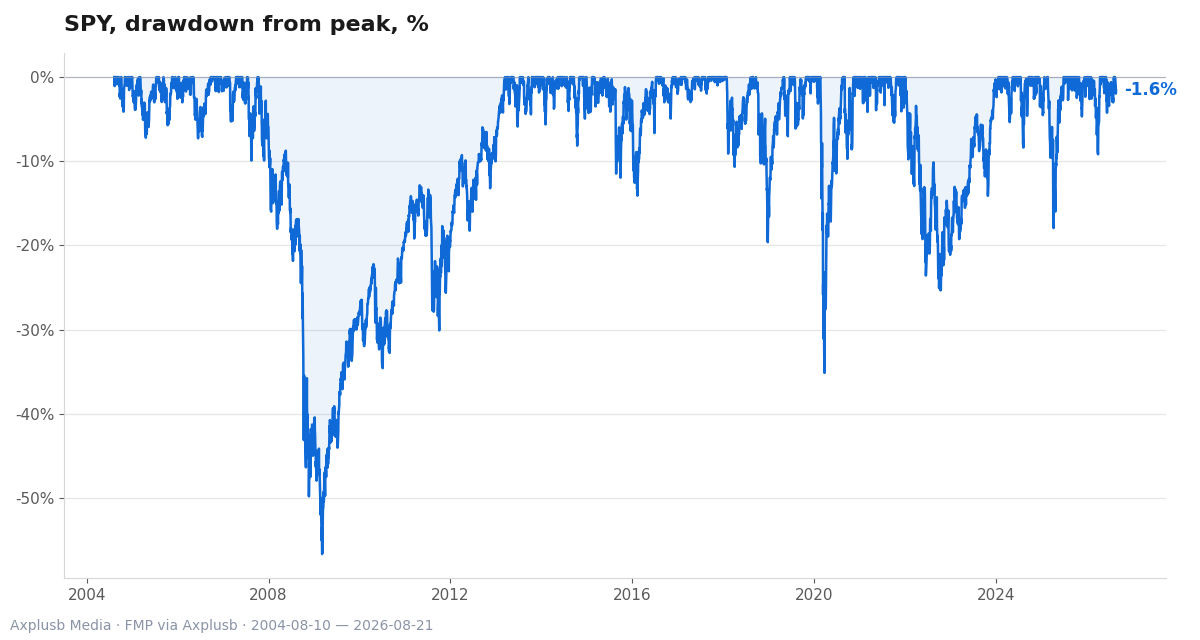
We have a starting number for equity tails. When global geopolitical risk rises, the probability of large negative stock returns at the 10th percentile increases by around 2–3 percentage points across 1–6 month horizons. The signal is stronger for acts than for threats, which helps with scenario calibration.
Amplification is non‑linear. Large geopolitical risk shocks cause disproportionate declines in consumption and equity prices. They also lift inflation expectations through oil price channels, which tightens financial conditions and sustains volatility, as documented in the Bank of England study.
Cross‑border transmission adds more skew. Tail events can hurt “riskier” countries more while pulling flows into perceived “safer” ones. That shift changes exchange rates, trade terms and asset valuations, in line with the international tail‑risk mechanism in BIS Working Paper 958.
Put the pieces together and you get a pattern. Geopolitical shocks raise downside odds, hit consumption and earnings, move inflation through energy, and prompt flight‑to‑quality and FX swings. The distribution changes shape, not just scale.
Common misconceptions investors bring to geopolitical tail risk
Myth 1: Tail risk is symmetric. In reality, left tails dominate when acts occur, while right tails tend to be slower and narrower. Options markets often price this skew as tensions rise, with two‑sided risk visible but different in depth and speed.
Myth 2: Gold is a free lunch. Historical scenarios show that modest allocations to gold, often in the 2–10% range, can reduce drawdowns. Yet timing, liquidity and correlation regimes matter, so gold can lag during certain growth shocks.
Myth 3: Puts always solve the problem. Options can be very effective, especially deep out‑of‑the‑money protection during acute episodes. They are also costly over time, with a carry burden that needs a clear budget, as highlighted by the AQR white paper.
Myth 4: Diversification eliminates spillovers. Tail shocks cross borders and asset classes through trade, funding and confidence channels. International risk sharing helps, but distributional effects persist even after rebalancing, consistent with BIS Working Paper 958.
Myth 5: Small shocks stay small. Impact depends on regime. Large geopolitical shocks can trigger non‑linear responses through consumption and inflation channels, which means small signals can tip into bigger moves, as the Bank of England study shows.
Designing credible scenarios and stress tests for geopolitical events
Start with attention and event definition. A practical framework blends text‑mined signals of market attention with a clear taxonomy of threats and acts. You then translate those events into portfolio‑level shocks across equities, rates, credit, FX and commodities.
Next, calibrate the tails. Use the empirical magnitudes on downside quantiles as anchors for equity and credit shocks. For acts, push the stress size higher than for threats. Build oil and inflation channels into macro paths to capture the known non‑linear amplification.
Include regime switches. Volatility clusters, correlations break and liquidity thins under stress. That means model parameters should switch when attention and price moves hit thresholds. It is better to design a simple regime rule than to assume one steady state.
Finally, pair forward scenarios with reverse stress testing. A reverse approach asks which plausible geopolitical path would most likely breach a given loss limit, then maps it to stressed default and loss assumptions for credit portfolios. One formal template embeds a geopolitical factor into a joint macro‑financial vector and derives the “most‑probable breach” scenario through constrained optimisation, as in recent reverse‑stress research.
Asset‑level responses: what hedges work, at what cost, and when to deploy them
Hedging is a toolkit, not a single instrument. Out‑of‑the‑money puts buy defined protection against sharp equity drops, yet the premium can be steep. Trend‑following and other tactical overlays can reduce drawdowns with lower carry, but they may lag during whipsaws, as the AQR white paper compares.
Gold has a long record as a geopolitical hedge. Modest allocations in the 2–10% range have often reduced drawdowns and improved tail outcomes relative to stock‑bond mixes. But the hedge depends on the regime and the liquidity you can access during stress.
Cross‑border tilts can help as well. Safer‑haven currencies and assets may benefit when risk flows shift, while riskier markets may bear deeper drawdowns during tail events. That is the asymmetric sharing channel described in BIS Working Paper 958.
To make trade‑offs tangible, keep a simple matrix in your playbook.
| Hedge/tilt | What it targets | Typical cost/drag | Liquidity and timing | When it helps |
|---|---|---|---|---|
| OTM equity puts | Sharp left‑tail equity drops | High, explicit premium | Good in major indices, degrades in stress | Acute “acts” and gap risk |
| Trend‑following overlay | Sustained downtrends and volatility | Moderate, model‑dependent | Liquid futures, may whipsaw | Clusters of stress |
| Gold (2–10%) | Risk‑off, inflation, currency stress | Low carry, price risk | Liquid, correlation regime‑dependent | Broad geopolitical stress |
| Defensive equity tilts | Earnings resilience, lower beta | Opportunity cost in rallies | High in large caps | Slow‑burn threats |
| FX/safe‑haven tilt | Flight‑to‑quality flows | Basis and carry costs | High in majors | Cross‑border spillovers |
When to deploy matters as much as what to deploy. Consider staggered hedges that scale with attention signals and spread volatility. Pre‑funding a budget for acute events helps avoid buying at the most expensive moment.
For deeper strategy context, see our guide to advanced tail‑risk strategies and a primer on tail‑risk hedging overlays.
Recent market evidence and short case studies (2025–26 episodes)
Case one is the energy‑led scare. Oil prices jumped on fresh tensions, inflation expectations nudged higher and rate markets repriced. Equities sold off while credit spreads pushed wider, then retraced in steps, in line with clustered volatility.
Case two is the tech‑led right tail. A strong AI narrative lifted index weights and pulled the right tail wider. Options markets priced in two‑sided risk, with demand for both downside and upside protection, as highlighted by Bloomberg Markets.
A third pattern is the act versus threat gap. Episodes with concrete actions saw sharper drawdowns and more persistent volatility. Threats often faded faster, yet they still raised the odds of a left‑tail outcome over the following months.
Across all three, one feature repeats. Correlations change when stress arrives, then stay unstable for a while. That makes static hedges less reliable unless they are paired with rules for scaling and roll decisions.
Counterarguments and limits of tail‑risk planning
There is no free hedge. Options carry costs that can weigh on long‑term returns. Trend overlays can whipsaw. Gold can lag for long stretches. The art is to size hedges to a budget and a pain point, as discussed in the AQR white paper.
Models can mislead when the world surprises you. Scenario calibration uses past episodes and current proxies. Yet geopolitical paths can jump states without warning. Guardrails help, but humility about model error is prudent.
Liquidity is a hidden risk in stress. Hedges that look cheap can become hard to scale when you most want them. That argues for pre‑funded plans with clear triggers rather than late scrambles.
Reverse stress tests can bridge the gap between messy politics and clean risk limits. They ask a concrete question about breach risk and find the most plausible path that gets you there. That makes the conversation with boards more practical, even when probabilities are vague.
Practical conclusions, governance and next steps for portfolio managers
Build a tail‑risk discipline that starts with measurement. Embed geopolitical‑calibrated downside quantiles into routine stress tests and performance at risk. Distinguish threats from acts and make the act shock larger by design.
Run a reverse‑stress exercise each quarter. Define a breach level for your fund and ask which plausible geopolitical path gets you there. Map it into stressed defaults, losses and liquidity needs for your holdings.
Cost and size your hedges against a set budget. Decide how much premium you can burn on options, how much leverage you allow for trend overlays, and what gold weight you tolerate in quiet times. Write those rules down and review them after each episode.
Set real monitoring triggers. Use attention measures and price‑based thresholds to scale hedges and tighten risk. Pair this with a short action playbook, so your team can respond quickly when events move from threat to act.
Check how disciplined your portfolio really is. If you paused during the last spike, consider tightening the triggers and pre‑funding the hedge budget.
For broader risk‑process design under live volatility, see our piece on dynamic risk management techniques and a framework for assessing geopolitical risk in portfolios.
A short technical note on methodology and governance
A workable geopolitical stress program has three pillars. First, event definition and attention signals that inform timing and size. Second, calibrated shocks and regimes that map to assets and cash flows. Third, a reverse‑stress layer that ties scenarios to governance thresholds.
Attention signals include text‑mined measures and market proxies. When these jump, your regime should switch and your hedge budget should scale. That is a rule, not a guess.
Calibrated shocks should reflect observed magnitudes in downside quantiles and the act versus threat gap. Oil and inflation channels should feed into rates, credit and equity cash flow paths. This is the non‑linear core you want to capture.
Reverse stress tests work best when tied to decisions. They should produce a small set of breaches with plausible paths and a list of levers. That list is your action menu for a long meeting that happens too fast.
Ready to test your setup in practice. Pick one live threat and one act from recent history and run both through your templates next week.
Related reading
- Navigating Tail Risk in Uncertain Markets: Advanced Strategies for Portfolio Protection
- Tail Risk Hedging: How Smart Investors Protect Against Black Swan Events
- Dynamic Risk Management Techniques for Today’s Complex Investment Landscape
- Assessing Portfolio Risk in an Era of Geopolitical Uncertainty