Drawdowns are not just big red numbers on a screen. They are the stories of how losses arrive, persist and compound. In a market that keeps inventing new ways to surprise us, revisiting how we measure and manage those stories is overdue.
This piece offers a pragmatic tour. We reframe measurement, review what actually works, and translate recent research into steps that fit a real investment process.
Reframing drawdown: what you measure is what you manage
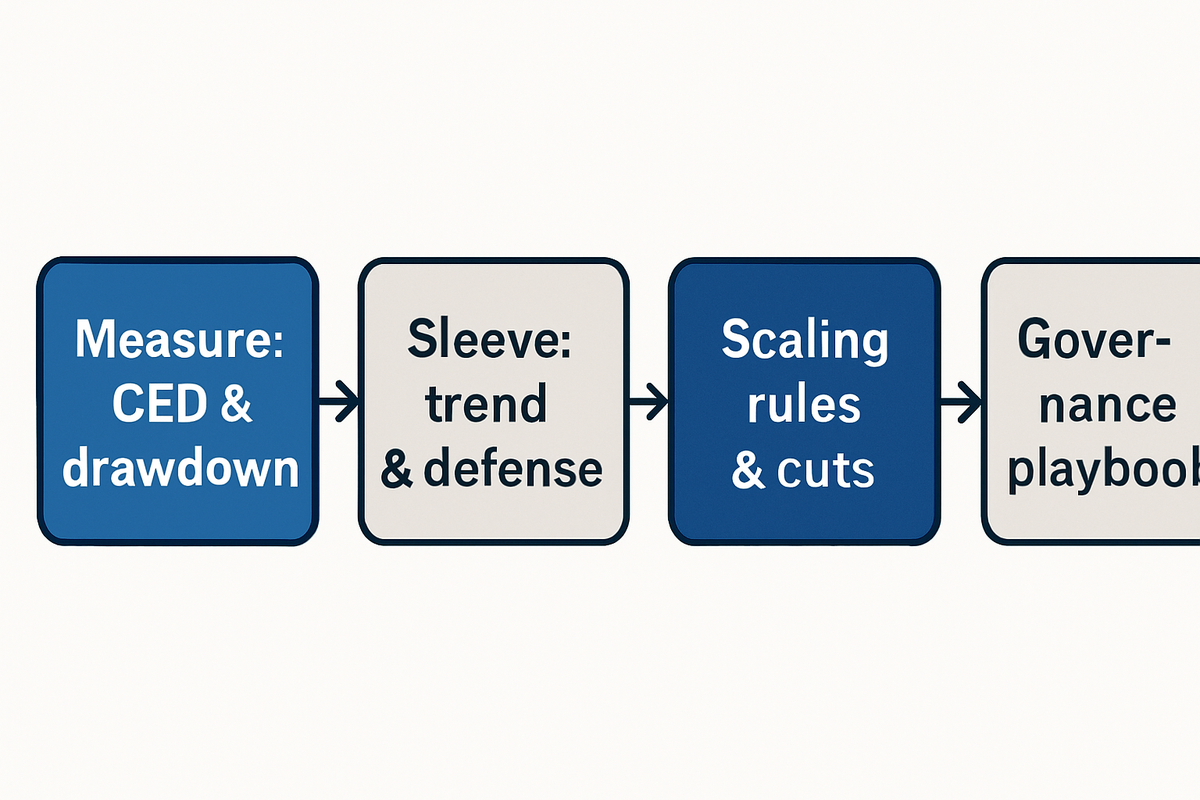
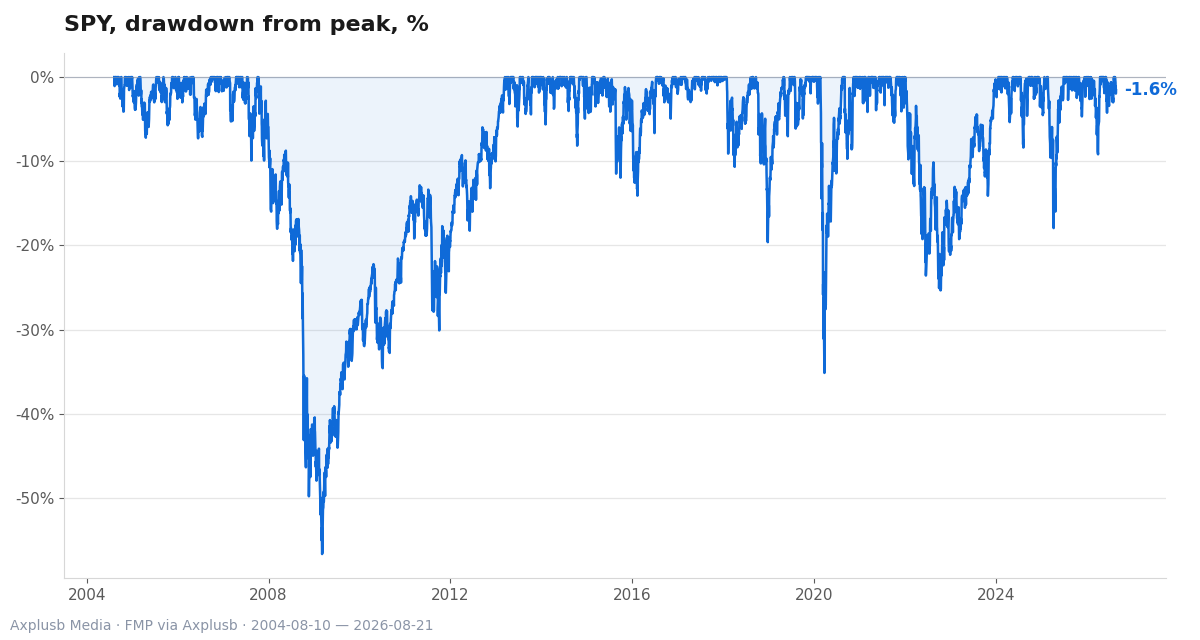
A drawdown is the drop from a recent peak to a subsequent trough. It is a path story, not a single-point risk like volatility. Two portfolios with the same annualized volatility can have very different drawdown histories because sequences matter.
Peak-to-trough depth is a blunt measure. It ignores how long you stayed underwater and how losses clustered. Conditional Expected Drawdown, introduced by Goldberg and Mahmoud, fixes that by measuring the average of the worst drawdowns over a period, much like Expected Shortfall averages the worst losses.
CED is convex and path dependent, which means optimizers can work with it. The original work also shows CED is sensitive to serial correlation in returns, so it captures the tendency of losses to arrive in streaks that investors actually feel.
If you optimize only for volatility or Value at Risk, you may hide exactly the risk that causes panic selling. A CED-aware process makes the pain visible, then allocates to avoid the stickiest parts of that pain.
Why drawdown management matters now: macro and liquidity move the goalposts
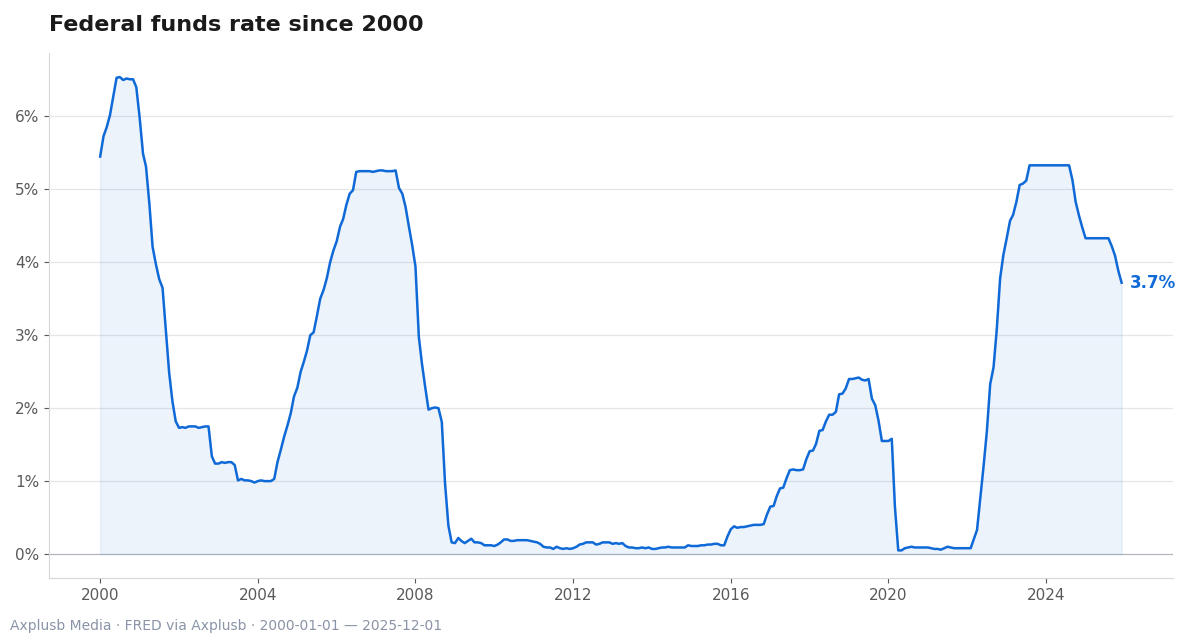
Global macro strategies have matured and, when chosen well, can lower portfolio drawdowns. BlackRock’s recent work adds a useful metric, “drawdown propensity,” to help select managers whose behavior during losses aligns with your goals, and it reports that smarter macro allocations can dampen equity-led drawdowns BlackRock’s recent work.
The same research warns that drawdown rules do not help every style. They tend to aid negatively skewed or crisis-protective strategies, but they can harm positively skewed or mean-reverting ones by cutting exposure right before rebounds.
Funding also draws down. During crises, firms use credit line drawdowns to secure liquidity and to keep investing, which changes how portfolio losses interact with real activity. The Federal Reserve’s study on credit line behavior highlights these funding‑liquidity feedbacks, which should inform stress scenarios and cash buffers.
As allocations to alternatives and macro grow, the old “equity plus bonds” framing is no longer enough. Drawdown control now needs to consider cross‑asset signals, manager selection and the cost of holding optionality.
The core toolkit: sleeves, trend and rules that scale
The evidence for systematic drawdown control is strongest for diversified trend‑following and defensive sleeves. AQR’s backtests show that a trend sleeve, paired with a simple defensive equity overlay, materially reduces multi‑year drawdowns versus a static allocation AQR’s backtests show.
Crucially, they describe an operational rule. When cumulative losses approach a floor near ten percent, the process begins to cut exposure gradually instead of flipping a switch. The cuts continue as losses deepen, then reverse when recovery takes hold.
AQR extends the case with design guidance for the sleeve itself. Use diversified trend signals across asset classes, balance speed and stability in the lookback, and be honest about costs, because real slippage can erode protection if you react too fast.
For a deeper overview of how these sleeves slot into a broader program, see Building Resilience: Systematic Strategies for Drawdown Management.
Design choices and trade‑offs when building a risk‑mitigating sleeve
You need to pick the markets, the signal horizons and how often to rebalance. AQR’s design checklist connects these choices to results, stressing that faster protection brings more trades and more slippage, while slower signals save costs but can arrive late.
Cross‑asset diversification matters. Trend across equities, rates, commodities and currencies shares the load, so no single market failure ruins the hedge. But this breadth raises operational complexity and data demands.
Rebalancing cadence is not a footnote. Weekly updates may overtrade in choppy periods, while monthly cadences may miss sharp breaks. AQR suggests aligning cadence with signal half‑life and known cost budgets, then monitoring realized slippage.
Transaction costs are not just fees. They are the price you pay for speed, and they should be in the budget you use to size the sleeve. Backtests that ignore slippage tend to promise more protection than they can deliver live.
| Design choice | Why it matters | Faster option (pros/cons) | Slower option (pros/cons) |
|---|---|---|---|
| Asset universe | Diversifies hedging paths | Broader: more chances to catch trends, higher complexity | Narrower: simpler, may miss offsets |
| Signal horizon | Controls speed of protection | Short: quicker cuts, higher costs and noise | Long: steadier, slower to react |
| Rebalance cadence | Ties signals to trades | Frequent: timely, more slippage | Infrequent: cheaper, may lag |
| Position scaling | Governs drawdown path | Aggressive: deeper cuts, more whipsaws | Gradual: smoother, slower relief |
Strategy selection: when drawdown rules help, and when they hurt
BlackRock’s “drawdown propensity” is a practical way to compare managers on the exact thing you care about during stress periods. Their analysis shows that adding macro managers with low drawdown propensity can lower the depth and duration of equity drawdowns drawdown propensity.
They also show that drawdown‑triggered rules interact with strategy skewness. Negatively skewed strategies, which can crash fast, often benefit from rules that cut risk early. Positively skewed or mean‑reverting approaches can be harmed by the same rules because they rely on rebounds after setbacks.
This is not a minor detail. If your core satellite is mean‑reverting, automatic exposure cuts near a small loss threshold can remove the very edge you paid for. If your core sleeve is crash‑sensitive, failing to cut may expose you to outsized tail losses.
Manager selection should therefore screen for skewness and drawdown propensity, not just Sharpe. The latter can be blind to pain that arrives in a few brutal weeks.
Common misconceptions and behavioral traps
One myth says drawdown rules always improve long‑run returns. The research is clear that protection often trades some upside for stability, and the net benefit depends on the strategy mix, the cost of trading and the timing of stress.
Another myth says one rule fits all. We just saw why skewness matters, and why mean‑reverting edges can be hurt by rigid triggers. The smarter approach picks tools that fit the engine you run and the situations you fear.
Behavior often breaks good plans. Harvard Business Review argues that organizations should invest in resilience, analytics and decision frameworks because many tail events are unforeseeable, and ad‑hoc reactions fail under pressure. That supports pre‑committed rules and governance that prevent loss‑driven whiplash when the heat rises.
Aswath Damodaran adds a personal dimension. He emphasizes matching strategy and risk management to your time horizon and temperament, and he warns against chasing recent performance after a shock. For a broader look at these themes, see The Role of Investor Psychology in Volatile Markets and Behavioral Biases in the Age of AI.
Empirical case studies and data points to ground decisions
AQR’s 2019 analysis runs long backtests that add a diversified trend sleeve and a simple defensive overlay to a core portfolio. The combined approach reduces multi‑year drawdowns versus a static allocation, while a gradual exposure‑cut rule helps avoid sharp equity selloffs by cutting risk near a ten percent loss threshold AQR’s 2019 analysis.
BlackRock’s 2026 paper links macro allocation quality to outcomes that investors feel. By selecting managers with lower drawdown propensity and by recognizing when drawdown rules fit the style, they show how portfolio drawdowns can be lowered without blunt de‑risking macro allocation quality.
J.P. Morgan takes a top‑down and bottom‑up view to hedge‑fund allocations. They classify roles such as Loss Mitigation or Equity Diversifier, then size allocations to the role, which creates clarity about how much drawdown protection the sleeve must deliver during equity stress J.P. Morgan takes a view.
The Federal Reserve’s research on credit line drawdowns adds a funding angle to portfolio design. During crises, firms draw on credit to fund operations and investment, which can shift the portfolio’s liquidity needs exactly when markets are strained. That is a reminder to align drawdown control with cash planning, not just market beta.
Counterarguments, implementation risks and governance
Costs are real. AQR’s design work underlines that faster rules and shorter lookbacks raise trading, slippage and false signals, which can drag down returns when markets churn.
Rules can also cut the winners. BlackRock stresses that positively skewed or mean‑reverting strategies can be harmed by drawdown gates that exit before the payoff arrives, and re‑entries after rebounds may be worse.
Funding‑liquidity loops matter. The Fed’s evidence on credit line drawdowns shows that cash needs rise in stress, which can force de‑risking at bad prices if you did not pre‑plan buffers.
The antidote is governance. HBR’s guidance points to pre‑committed decision protocols and resilience investments that let you stick to the plan when discomfort peaks. Clear role definitions and escalation paths reduce the odds of rash, mid‑drawdown pivots.
A practical drawdown playbook: metrics, rules and operational steps
Start with measurement that honors the path. Add Conditional Expected Drawdown to your risk dashboard, then run optimizations that constrain CED or penalize it directly to shape the drawdown path you can live with.
Define roles and size sleeves to their purpose. J.P. Morgan’s role‑based approach helps you state how much loss mitigation you want from each sleeve and how it should behave when equities fall.
Implement rules that scale, not flip. The AQR “gradual exposure‑cut near a ten percent floor” approach is designed to provide early relief without whipsawing on noise, and it is operationally simple to audit.
Design the trend sleeve with your budget in mind. Diversify signals across asset classes, choose horizons that match your cost tolerance, and set a rebalance cadence that fits the signal’s half‑life.
Hardwire decisions before stress hits. Following HBR’s advice, write down the triggers, the committees and the actions in a playbook, then test the process in tabletop exercises so the first time you use it is not mid‑crisis.
Align the plan with temperament and time horizon. Damodaran’s warning against strategy whiplash is a reminder to choose tools you can hold through their cold streaks, even when peers move the other way.
Embed manager selection metrics that fit drawdown goals. Use BlackRock’s drawdown propensity concept and skewness screens to pick macro managers who behave as intended when it counts.
Check how disciplined your portfolio really is. If the answer is vague, you have your next project.
- Adopt a CED‑aware optimization and dashboard.
- Define role‑based sizing for risk‑mitigating sleeves.
- Implement gradual exposure‑cut mechanics near pre‑set floors.
- Diversify and budget your trend sleeve for costs and slippage.
- Pre‑commit governance: triggers, actions, and escalation.
- Align with investor temperament and horizon to reduce whiplash.
- Screen managers for drawdown propensity and skewness.
Final takeaways and next steps for practitioners
Measure drawdowns the way investors experience them. Path‑dependent metrics like CED surface risks that simple volatility hides.
Design strategy‑aware rules. Trend and defensive sleeves can cushion multi‑year losses, but the same rules can harm positively skewed or mean‑reverting edges if used blindly.
Budget for costs and test the plan. Speed, slippage and liquidity interact during stress, and ignoring those links is the fastest route to disappointment.
Hardwire governance and behavior. Pre‑committed protocols and role clarity raise the odds that you will execute calmly when losses arrive.
If you want to dig deeper into system design, start with our guide to systematic drawdown management and complement it with behavioral safeguards from our volatility psychology primer. Then audit your own rules. Small improvements to measurement, sizing and execution can save months of recovery time.
Ready to turn this into a playbook you can run on Monday morning?
Related reading
- Building Resilience: Systematic Strategies for Drawdown Management
- The Role of Investor Psychology in Volatile Markets: Strategies for Resilience
- Behavioral Biases in the Age of AI: Adapting Investor Strategies for the Digital Age