WAKIX drives nearly all of Harmony Biosciences’ revenue, and the market is pricing the stock well below the cash flow that single drug already generates.
Harmony Biosciences Holdings, Inc. is a commercial-stage pharmaceutical company focused on developing and marketing therapies for rare neurological conditions in the United States. Its flagship product, WAKIX, is a prescription medicine for excessive daytime sleepiness in adults with narcolepsy. Founded in 2017 and renamed from Harmony Biosciences II, Inc. in February 2020, the company is based in Plymouth Meeting, Pennsylvania.
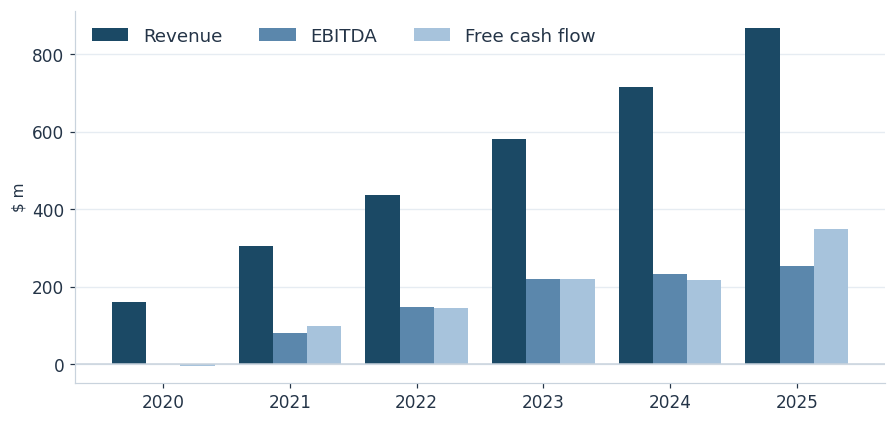
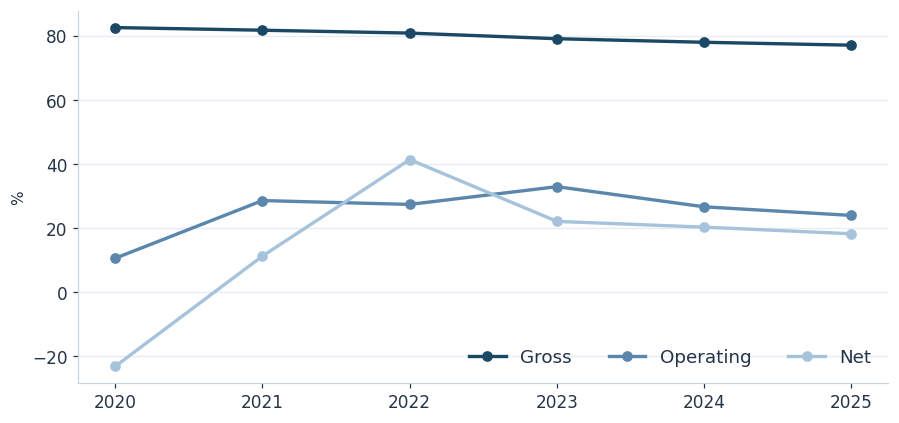
With a market capitalization of $2.28 billion, Harmony generates nearly all of its revenue from WAKIX (pitolisant): trailing-twelve-month (TTM) revenue of $960 million, a 75.4% gross margin and a 24.0% operating margin. Revenue has grown at a five-year annual rate of 40.3%. The balance sheet carries a net cash position of $396 million, interest coverage of 17x and a current ratio of 3.48; TTM free cash flow stands at $355 million, a 15.6% FCF yield.
Investment thesis
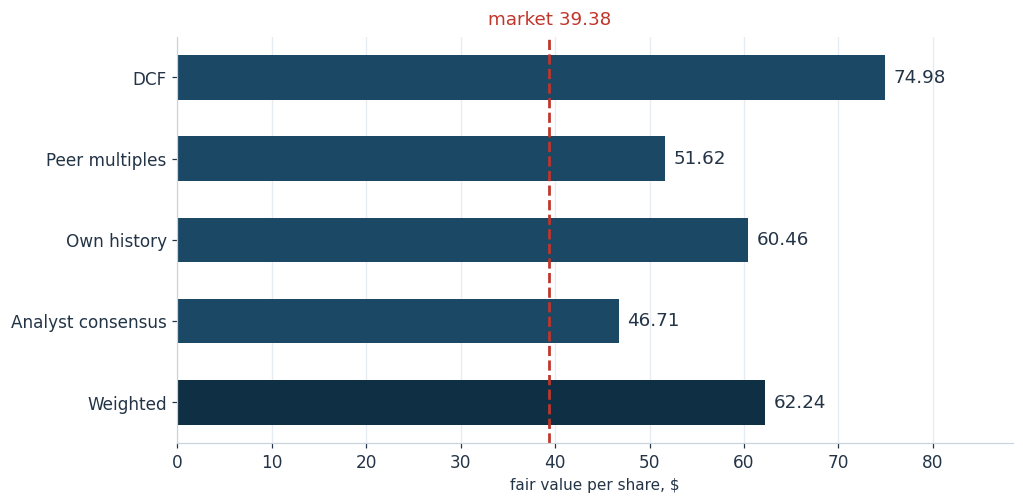
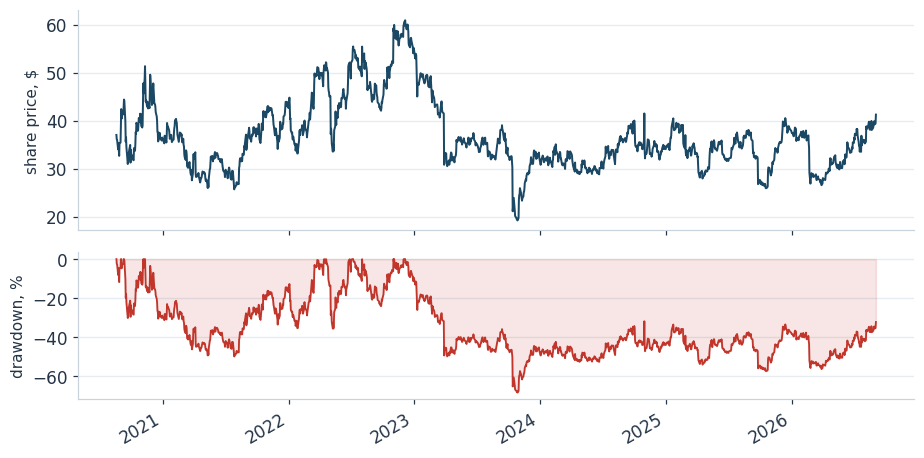
At $39.38, Harmony trades well below its estimated fair value of $62.24, a 58.1% upside against a 31.5% expected drawdown. The gap is unusually wide for a profitable, cash-generative company.
Forward multiples sit below trailing ones — a P/E of 10.0x versus 12.6x trailing, and an EV/EBITDA of 5.8x versus 6.8x — implying the market expects earnings to keep growing rather than shrink. That is not the case for several other names in this peer set.
TTM operating and net earnings sit within 2% of their eight-quarter norm, so current profitability is not inflated by one-off items; the valuation case does not depend on normalizing earnings.
The business
WAKIX (pitolisant) treats excessive daytime sleepiness in adult narcolepsy patients and is Harmony’s only significant commercial product. That concentration is the defining feature of the business: the 40.3% five-year revenue growth rate and 75.4% gross margin both flow from a single drug — and so does essentially all downside risk.
Growth has been driven mainly by wider use of WAKIX among diagnosed patients rather than by an expanding pool of patients: quarterly revenue growth of 30% year-on-year has come alongside guidance of $1.0-1.04 billion for the year. Two pipeline programs — an extended-release formulation, pitolisant GR, awaiting an FDA decision in the first quarter of 2027, and an earlier-stage orexin program — are the company’s route to diversifying beyond this single product.
| Metric | Value |
|---|---|
| Sector / industry | Healthcare / Biotechnology |
| Country, exchange | US, NASDAQ |
| Market capitalisation | $2.28 bn |
| Enterprise Value | $1.88 bn |
| Net debt | −$395.8 m |
| Employees | 293 |
| IPO | 2020-08-19 |
| Beta (FMP) | 0.91 |
| Metric | Value | Metric | Value |
|---|---|---|---|
| Revenue TTM | $959.9 m | Gross margin | 75.4% |
| EBITDA TTM | $276.4 m | Operating margin | 24.0% |
| Net income TTM | $181.3 m | Net margin | 18.9% |
| Operating CF TTM | $355.1 m | FCF margin | 37.0% |
| Free cash flow TTM | $354.9 m | ROE | 18.1% |
| Capex TTM | −$178 000.00 | ROA | 13.2% |
| Total debt | $154.0 m | ROIC | 28.7% |
| Cash | $667.8 m | Net Debt / EBITDA | -1.43× |
| Shareholders’ equity | $999.2 m | Debt / Equity | 0.15× |
| Current ratio | 3.48× | Quick ratio | 3.45× |
| Interest coverage | 17.1× | Equity / assets | 72.8% |
| Revenue growth 5y (CAGR) | 40.3% | Earnings growth 5y (CAGR) | — |
| Revenue growth 1y | 21.5% | Expected revenue growth | 3.3% |
| Expected EPS growth | 11.7% | Payout ratio | — |
| Risk metric | Value | Risk metric | Value |
|---|---|---|---|
| Volatility, 1 year | 44.3% | Expected volatility (EWMA) | 39.0% |
| Volatility, 3 years | 48.9% | Volatility, full history | 52.1% |
| Downside deviation | 40.4% | Beta to SPY | 0.81 |
| Maximum drawdown | -68.5% | Trough date | 2023-10-27 |
| Current drawdown | -35.3% | Drawdown recovered | no |
| Median annual drawdown | -35.7% | Tail annual drawdown (10%) | -50.8% |
| Expected drawdown (1 year) | -31.5% | Correlation with the benchmark | 0.26 |
| VaR 95% (1 day, historical) | 4.3% | VaR 99% (1 day, historical) | 9.2% |
| CVaR 95% | 7.6% | CVaR 99% | 14.6% |
| Sharpe | -0.06 | Sortino | -0.08 |
| Calmar | 0.02 | Price CAGR over the period | 1.0% |
| Return, 1 year | 3.7% | Return, 3 years | 23.5% |
Financial performance
| Year | Revenue | Gross Profit | Operating Income | EBITDA | Net Income | Operating CF | FCF |
|---|---|---|---|---|---|---|---|
| 2020 | $159.7 m | $132.0 m | $17.0 m | $1.5 m | −$36.9 m | −$3.0 m | −$5.0 m |
| 2021 | $305.4 m | $249.9 m | $87.5 m | $80.5 m | $34.6 m | $98.6 m | $98.3 m |
| 2022 | $437.9 m | $354.4 m | $120.2 m | $146.9 m | $181.5 m | $144.5 m | $144.3 m |
| 2023 | $582.0 m | $460.8 m | $192.0 m | $221.5 m | $128.9 m | $219.4 m | $219.1 m |
| 2024 | $714.7 m | $557.9 m | $190.8 m | $233.4 m | $145.5 m | $219.8 m | $218.7 m |
| 2025 | $868.5 m | $670.1 m | $208.5 m | $255.0 m | $158.7 m | $348.2 m | $347.9 m |
Valuation multiples and peers
| Multiple | Company | 5-year median | Peer median |
|---|---|---|---|
| P/E | 12.6× | 14.9× | 16.3× |
| Forward P/E | 10.0× | — | — |
| P/S | 2.4× | 3.3× | 2.4× |
| P/B | 2.3× | 4.1× | 2.6× |
| P/FCF | 6.4× | — | — |
| EV/EBITDA | 6.8× | 8.1× | 9.5× |
| Forward EV/EBITDA | 5.8× | — | — |
| EV/Sales | 2.0× | — | 2.5× |
| EV/EBIT | 8.2× | — | — |
| PEG | 1.08× | — | — |
| FCF Yield | 15.6% | — | 9.7% |
| Earnings Yield | 8.0% | — | — |
| Dividend Yield | — | — | 0.0% |
| Enterprise Value | $1.88 bn | — | — |
| Ticker | Company | Mkt cap | P/E | P/S | EV/EBITDA | Net margin | ROE | Beta |
|---|---|---|---|---|---|---|---|---|
| CORT | Corcept Therapeutics Incorpo | $12.25 bn | 218.0× | 14.7× | 422.1× | 6.6% | 8.4% | 0.46 |
| SUPN | Supernus Pharmaceuticals, In | $2.57 bn | -23.0× | 3.1× | -152.9× | -13.2% | -10.4% | 0.56 |
| AMPH | Amphastar Pharmaceuticals, I | $993.4 m | 12.9× | 1.4× | 8.3× | 10.8% | 10.1% | 0.90 |
| ANIP | ANI Pharmaceuticals, Inc. | $1.67 bn | 15.2× | 1.7× | 6.4× | 10.8% | 19.2% | 0.46 |
| COLL | Collegium Pharmaceutical, In | $798.2 m | 16.1× | 1.0× | 2.6× | 5.9% | 16.0% | 0.76 |
| PCRX | Pacira BioSciences, Inc. | $1.02 bn | 73.6× | 1.4× | 10.7× | 2.0% | 2.1% | 0.27 |
| ALKS | Alkermes plc | $7.88 bn | 116.6× | 4.7× | 41.0× | 4.0% | 3.7% | 0.27 |
| JAZZ | Jazz Pharmaceuticals plc | $15.75 bn | 16.5× | 3.4× | 12.6× | 20.4% | 21.4% | 0.32 |
| — median — | 16.3× | 2.4× | 9.5× | 6.3% | 9.2% | 0.46 |
Fair value
The fair-value range spans $46.71 to $74.98, a 71.8-point gap between methods that reflects different assumptions about growth rather than any single flawed input. The DCF applies an 8.0% discount rate and a starting growth rate of 3.3% (analyst consensus) fading to a 2.5% terminal rate over five years, with the terminal value accounting for 77.0% of enterprise value; that computation produces the top of the range at $74.98, versus $60.46 from historical multiples and $46.71 from consensus estimates.
| Method | Fair value | Weight | Upside |
|---|---|---|---|
| DCF (two-stage, FCFF + Gordon) | 74.98 | 40% | 90.4% |
| Peer-multiple valuation (peer medians); revenue multiples excluded — margin differs from the group median by 3.01 times | 51.62 | 30% | 31.1% |
| Own-history valuation (company’s own 10-year median multiples applied to reported TTM earnings) | 60.46 | 20% | 53.5% |
| Analyst consensus (FMP price target) | 46.71 | 10% | 18.6% |
| Weighted fair value | 62.24 | 100% | 58.1% |
| WACC component | Value |
|---|---|
| Risk-free rate | 4.2% |
| Equity risk premium (ERP) | 4.5% |
| Beta | 0.87 (regression to the benchmark, Blume adjustment (raw 0.81)) |
| Cost of equity (CAPM) | 8.1% |
| Cost of debt | 8.8% (interest expense / debt) |
| Effective tax rate | 24.8% |
| Weights: equity / debt | 93.7% / 6.3% |
| WACC | 8.0% |
| Year | Growth rate | FCFF | Present value |
|---|---|---|---|
| 1 | 3.3% | $215.7 m | $199.7 m |
| 2 | 3.1% | $222.5 m | $190.6 m |
| 3 | 2.9% | $228.9 m | $181.6 m |
| 4 | 2.7% | $235.1 m | $172.7 m |
| 5 | 2.5% | $241.0 m | $163.8 m |
| Terminal value | 2.5% | $4.47 bn | $3.04 bn |
| WACC \ terminal growth | 1.5% | 2.0% | 2.5% | 3.0% | 3.5% |
|---|---|---|---|---|---|
| 6.5% | 82.79 | 90.61 | 100.37 | 112.90 | 129.55 |
| 7.3% | 72.92 | 78.70 | 85.68 | 94.30 | 105.20 |
| 8.0% | 65.31 | 69.75 | 74.98 | 81.26 | 88.92 |
| 8.8% | 59.27 | 62.77 | 66.83 | 71.60 | 77.26 |
| 9.5% | 54.36 | 57.19 | 60.43 | 64.15 | 68.50 |
| Scenario | Growth rate | Discount rate | Terminal growth | Fair value | Upside |
|---|---|---|---|---|---|
| Bear case | -0.3% | 9.5% | 2.0% | 53.13 | 34.9% |
| Base case | 3.3% | 8.0% | 2.5% | 74.98 | 90.4% |
| Bull case | 6.3% | 7.0% | 3.0% | 106.39 | 170.2% |
Risk profile
The central risk is complete dependence on a single drug: any competitive, regulatory or patent development around WAKIX flows straight into the business, with no offsetting product line to absorb it.
Patent protection is structured but not final. A settlement over an ANDA challenge keeps Lupin from launching a generic before January 2030, but in April 2026 the company sued AET Pharma and Sandoz over a patent covering pitolisant’s amorphous form; the outcome will determine whether 2030 holds as the real boundary or a generic enters earlier.
Diversification rests on two clinical programs: pitolisant GR awaits an FDA decision in the first quarter of 2027, and the earlier-stage orexin program competes with better-funded rivals. A rejection of pitolisant GR would leave Harmony a single-product company until the patent cliff.
The addressable population is narrow — narcolepsy is a rare disease — and recent growth has come mostly from deeper penetration of that population rather than its expansion, pointing toward an eventual plateau within the $1.0-1.04 billion guidance range. A July 2026 CFO change, alongside record preliminary results, adds some near-term uncertainty to forecasting even though the transition itself appears unremarkable. Finally, TTM free cash flow of $355 million runs about 1.6 times the company’s more typical annual level of roughly $219 million, so a 15.6% FCF yield should be read as closer to 9-10% on a sustained basis.
| Versus the benchmark (SPY) | Company | Benchmark |
|---|---|---|
| CAGR | 1.0% | 13.4% |
| Volatility | 52.1% | 17.8% |
| Maximum drawdown | -68.5% | -34.1% |
| Return, 1 year | 3.7% | 18.2% |
| Reward vs risk | Value |
|---|---|
| Upside | 58.1% |
| Downside | -31.5% |
| — bear-case DCF | 34.9% |
| — expected annual drawdown | -31.5% |
| Risk / reward (upside to downside) | 1.85× |
| Upside per unit of volatility | 1.49 |
Scoring and verdict
Harmony’s case for a Buy rests on three legs that each hold up independently. First, valuation: a $62.24 fair-value estimate against a $39.38 price implies 58.1% upside versus an estimated 31.5% drawdown, a favorable balance even after allowing for the spread between valuation methods. Second, earnings quality: TTM operating and net income are within 2% of their eight-quarter average, so the multiples are not being flattered by unusually strong results. Third, market expectations: forward P/E and EV/EBITDA multiples sit below trailing multiples, meaning the market is pricing in further earnings growth rather than a slowdown — the opposite pattern from several peers in the same specialty-pharma group, including INCY, ABUS, RIGL and MGTX. The free-cash-flow point noted above is the one caveat worth carrying forward, but it affects the read on cash generation rather than the underlying earnings-based valuation.
| Scoring block | Weight | Score (0–100) |
|---|---|---|
| valuation | 35% | 98 |
| quality | 20% | 86 |
| growth | 15% | 68 |
| financial | 15% | 96 |
| risk | 15% | 63 |
| Total score | 100% | 86.0 |
| Buy criterion, explicit | Value |
|---|---|
| Actual upside | 58.1% |
| Upside required for a Buy | 4.1% |
| Gap | -53.9 pp |
| Points short of the threshold | 0.0 |
| Binding block | risk |
Catalysts
- FDA decision on the extended-release formulation pitolisant GR, expected in the first quarter of 2027 — the first product that would end the single-drug dependence and extend the franchise beyond the 2030 patent horizon.
- Outcome of the patent litigation against Sandoz and AET Pharma over pitolisant’s amorphous form — a win would confirm January 2030 as the real boundary on generic competition.
- Data from the earlier-stage orexin program, where positive results would re-rate the company rather than a single product line.
- Delivery of, or an increase to, the $1.0-1.04 billion revenue guidance for 2026, following WAKIX’s $261 million quarter and 30% year-on-year growth.
- Normalization of working capital that clarifies whether sustainable free cash flow is closer to $219 million than to the reported $355 million TTM figure.
Risks
- Complete revenue dependence on a single drug, WAKIX.
- Ongoing patent litigation with Sandoz and AET Pharma over pitolisant’s amorphous form, which could move the 2030 generic-entry boundary earlier.
- Binary clinical outcomes on pitolisant GR (FDA decision due Q1 2027) and the earlier-stage orexin program.
- A narrow, rare-disease patient population, with recent growth driven mainly by deeper penetration rather than market expansion.
- A July 2026 CFO transition that adds near-term forecasting uncertainty.
- Free cash flow running well above its typical annual level, implying a lower sustainable FCF yield than the trailing figure suggests.
Investment conclusion
Harmony Biosciences is, by design, a bet on one drug. WAKIX funds all of the company’s growth, margin and cash generation, and nearly all of its risk sits in the same place: patent timing, clinical readouts for the programs meant to diversify the franchise, and the natural ceiling of a rare-disease population.
At current prices, the market appears to be underweighting the cash-flow strength already on the balance sheet relative to risks that are, for now, well defined rather than open-ended. That combination — a wide valuation gap against a concentrated but quantifiable risk profile — is the basis for a Buy rating.
Every figure, table and chart comes from Axplusb in-house quantitative research, 09.2026. Charts are redrawn from the same underlying data.
This article is an editorial summary of an in-house quantitative research report. It is information, not investment advice, and it is not a personal recommendation: prices, fair-value estimates and risk metrics are as of the date of the underlying research and change with the market.