Diversification works—until it does not. In quiet markets, weak links between assets help portfolios ride out bumps. Under stress, those links thicken fast and the expected risk reduction fades, sometimes when it is most needed.
This brief looks at what actually breaks in crises, how to see it early, and what it costs when hedges stop hedging. It leans on empirical work that tracks the surge of common risk components during turmoil and on diagnostics investors can run without a research lab.
What diversification under stress actually means
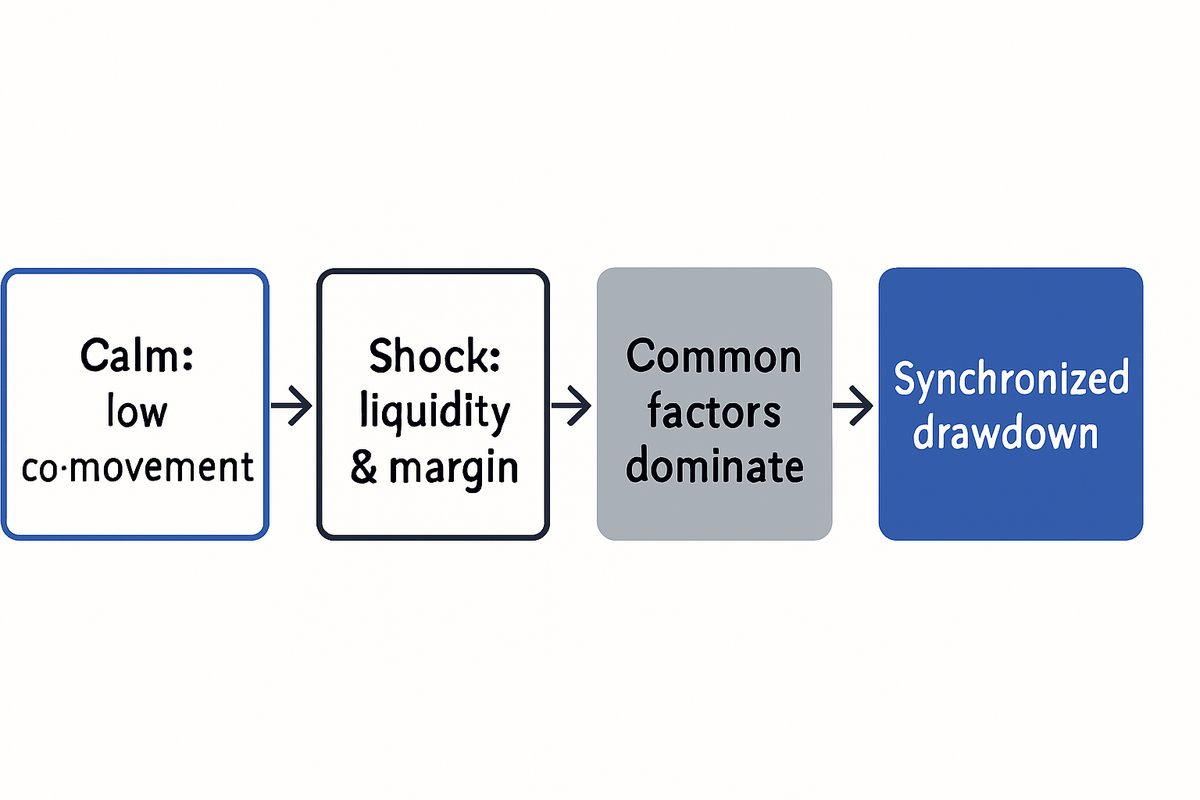
Diversification under stress is the loss of expected risk reduction when asset co-movements intensify in a crisis. It happens when portfolios that looked independent begin to respond to the same shocks.
Research pinpoints the mechanism. The first two principal components of global return covariances spike sharply in crises, with the first linked to volatility and the second to shifting crisis loadings, according to NBER work on shocks to systematic risk.
Sector diversification weakens for the same reason. The leading eigenvalue of the equity correlation matrix rises during stress, indicating high collective behaviour that drowns out idiosyncratic noise, as shown in Physica A research on equity sector structures.
There is also a tail story. Heavy-tailed returns and positive tail dependence make linear correlations understate crisis co-movement, which is why traditional hedges can fail even when average correlations looked modest in calm times.
The upshot is simple. In stress, common factors dominate, cross-links thicken and the portfolio that seemed diversified shares more of the same fate than the risk model implied.
Why this topic matters today
Regime shifts and geopolitical shocks have been flipping correlation regimes quickly. What worked as a hedge last quarter can turn pro-cyclical when the shock hits a shared balance sheet or liquidity pool.
Market plumbing amplifies that flip. The Bank for International Settlements documents that its Market Conditions Indicators spike during the global financial crisis and the COVID-19 shock, periods when liquidity dislocations grew and spillovers intensified, see the BIS Quarterly Review on market stress.
Recent practice points the same way. Institutional research notes that inflation dynamics, supply shocks and geopolitics can switch the sign and strength of cross-asset correlations, while liquidity constraints curb hedging capacity.
Episodes of “dash to cash” illustrate the point. In March 2026, investors sold equities, bonds and even gold while piling into money market funds, a pattern consistent with a rapid correlation regime shift and liquidity stress.
The mechanics: how correlation breakdowns happen
When stress rises, dealers and market makers pull back. Balance sheet limits mean less inventory and wider spreads, which feed into forced selling across exposures that share funding lines and margining.
In the data, this shows up as surging common components. The first principal component tied to volatility jumps in crises, while a second “crisis” factor reflects changing loadings across assets, per the NBER analysis of systematic risk shocks.
At the sector level, networks tighten. The leading eigenvalue of the correlation matrix rises and modular structure weakens, which means sector-based diversification gives way to market-wide co-movement, as the Physica A study on sector diversification breakdowns documents.
Plumbing and risk factors meet in the tape. Liquidity drains translate into higher effective betas to the market and to volatility itself, so positions once orthogonal to each other begin to move together.
How much diversification is lost: what the data say
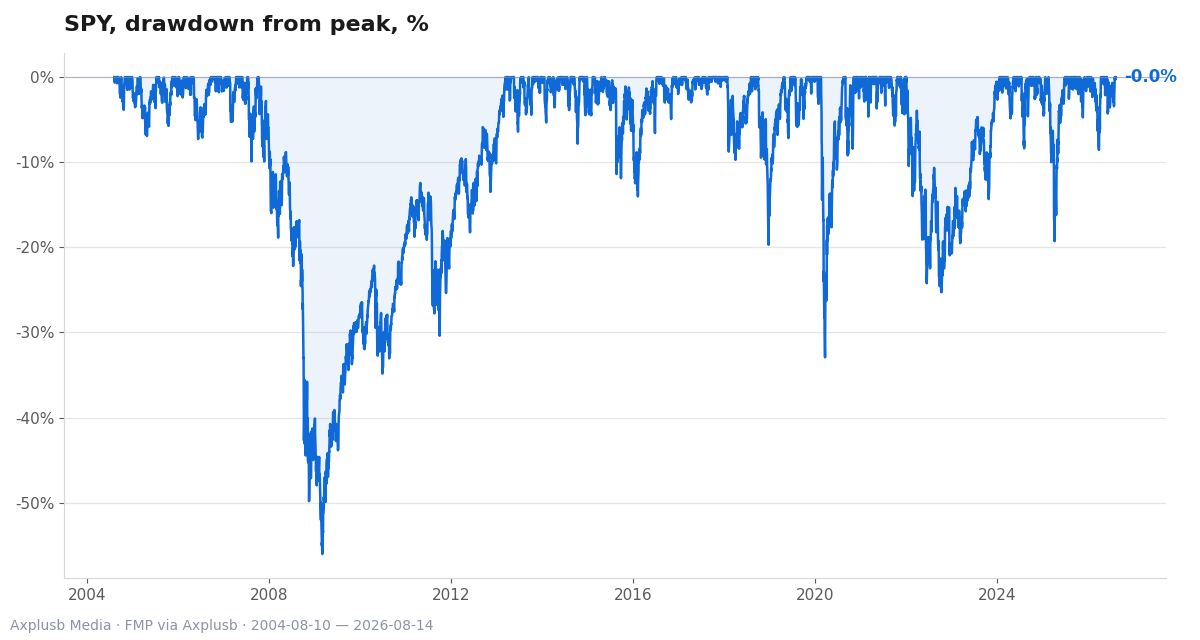
Crisis diagnostics show abrupt concentration of risk. In global data, principal components account for a far larger share of variance during stress, which is shorthand for “many things moving together,” based on NBER’s principal component evidence.
Equity sector studies reinforce this picture. The leading eigenvalue spikes in drawdowns, mapping to high collective behaviour and reduced room for sector selection to cushion losses, as shown in Physica A’s correlation-structure results.
Market conditions add fuel. During the GFC and COVID-19, BIS indicators of dislocation and illiquidity jumped, linking microstructure strain to stronger cross-asset spillovers, which undercuts diversification at the worst times as seen in the BIS market conditions framework.
For portfolios, this means larger and faster drawdowns than a static correlation matrix would suggest. It also means hedges that rely on average behaviour may deliver too little, too late.
Why simple correlations lie: tails, copulas and VaR failures
Pearson correlations are averages. They miss how dependencies change in the extremes, and they assume elliptical distributions that real markets rarely honour in stress.
Heavy tails and positive tail dependence complicate risk aggregation. Theory shows that under such conditions, Value-at-Risk can lose diversification benefits and become near-additive in the tails — a formal explanation for why many hedges fail right when losses cluster.
This does not contradict principal component evidence. It complements it by showing why the linear picture understates co-movement severity when volatility spikes and loadings shift, as identified in the NBER work on crisis-driven components.
The fix is not a new magic number. It is a different set of lenses: tail-dependence coefficients, copulas that allow asymmetric clustering, and loss metrics like CVaR that focus on extremes rather than the median day.
If you want a primer on the distinction, see our earlier look at correlation vs. diversification and why a single statistic can mislead.
Diagnostics and stress‑testing you can actually run
You can monitor the same things academics measure. Track the leading eigenvalue of your asset correlation matrix and how much variance is explained by the first two components across your book.
Pair that with market plumbing. Use liquidity and dislocation indicators similar in spirit to the BIS Market Conditions Indicators, and treat sharp jumps as warnings that co-movement risk is rising.
Bring in tails. Estimate tail-dependence coefficients for your key hedges and compare Conditional VaR in normal versus stressed windows to gauge how much protection survives a shock.
Set rules before you need them. For example, if the leading eigenvalue breaches a threshold or the explained variance by PC1+PC2 doubles from baseline, slow rebalancing, raise cash and cap gross leverage.
| Diagnostic | What it signals | Practical threshold idea | Portfolio action |
|---|---|---|---|
| Leading eigenvalue (λ1) | Collective behaviour rising | λ1 up sharply vs. 1-year median | Cut cyclicals, raise cash buffer |
| Variance explained by PC1+PC2 | Dominance of common shocks | PC1+PC2 share jumps in crisis | Tighten hedges, reduce leverage |
| Liquidity/dislocation proxy | Market plumbing strain | Spread/impact spikes | Widen rebalancing bands |
| Tail-dependence coefficient | Extreme co-movement risk | High and rising in pairs | Switch to convex hedges |
If you want a walkthrough of building and using these tests, we covered practical steps in Stress Testing Your Portfolio: Assessing Vulnerabilities.
Check how disciplined your portfolio really is.
Case studies: when hedges stopped hedging
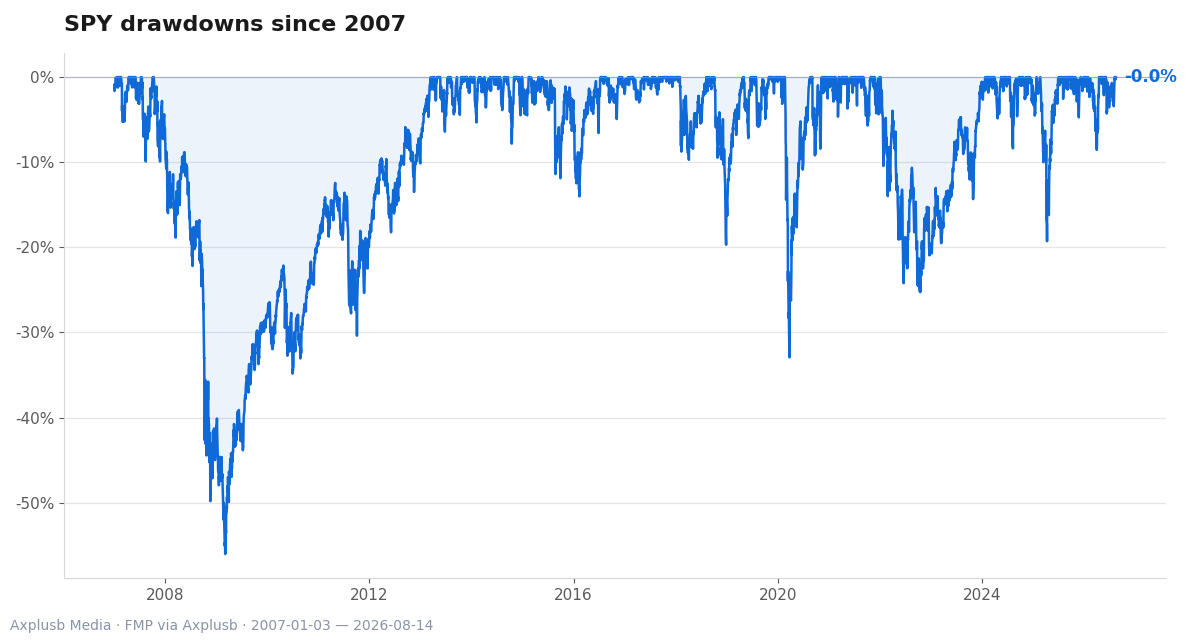
During the global financial crisis, liquidity vanished in core fixed income while equities plunged. BIS market indicators captured the dislocation, and cross-asset spillovers intensified as dealer balance sheets shrank.
In March 2020, safe-haven trades wobbled before stabilising. The same BIS framework showed spikes in stress, consistent with the brief period when investors sold what they could, not what they wanted.
More recently, a March 2026 geopolitical shock produced a “dash to cash.” Investors sold equities, bonds and even gold while money market funds drew strong inflows, a real-time example of correlation regime shifts under liquidity duress.
Patterns in principal components match these episodes. In such windows, the volatility-driven component surges and crisis loadings change across assets, making ex-ante hedging difficult, as documented by the NBER study on systematic shocks.
If you want the behavioural angle that often amplifies these swings, we unpack it in Behavioral Biases in Times of Market Stress.
Counterarguments and important caveats
Diversification is not dead. Over long horizons, international diversification tends to work even if it fails in many short-run drawdowns — the long arc of markets still favours spreading risk.
The caveat is the path. Investors have to survive the journey for the destination to matter, which means building for stress rather than assuming average regimes.
Regimes themselves are not constant. Practitioner evidence points to frequent flips in correlation sign and strength, with liquidity constraints that make hedging harder in real time.
In plain terms, time horizon matters. What fails this quarter can help over five years, but only if you keep losses within bounds that your process and clients can tolerate.
Practical takeaways: portfolio rules under stress
Here are rules that travel well from research to practice.
- Pre‑commit to stress triggers tied to eigenvalue and liquidity diagnostics, not price alone.
- Hold explicit liquidity buffers sized to collateral calls, not to comfort.
- Use tail‑aware measures (CVaR, tail dependence) to size hedges and avoid false comfort from low average correlations.
- Prefer scalable hedges that do not rely on dealer balance sheets when stress hits.
- Rebalance conditionally — widen bands and slow down when co‑movement signals flash.
- Model cross‑asset correlation flips in scenarios; assume bond–equity hedges can fail.
- Keep gross leverage capped when PC1 and dislocation indicators surge together.
- Document the plan so it is automatic under pressure.
Two more process notes can help. First, test what happens if PC1+PC2 explain twice the normal variance across your book, using historical stress windows as templates. Second, simulate funding and margin waterfalls under that state and make sure cash buffers can carry you.
If you want tools to implement these tests, revisit decision-making under uncertainty techniques that help force discipline when signals and prices move fast.
Stress test before the next shock rather than during it.
Broader implications for risk management and policy
When diversification fails, costs spill beyond individual portfolios. Forced liquidations and dealer retrenchment can propagate stress across markets, which raises the social cost of poor preparation.
Systemic surveillance should track co-movement directly. Principal component shocks and concentration of variance are useful early warnings, as shown in the NBER analysis of crisis components.
Plumbing matters as much as prices. Regulators and risk managers should monitor and publish market condition indicators that capture liquidity and dislocation — the BIS approach to MCIs is a practical template.
Policy can go further. Embedding tail-aware risk metrics in capital and liquidity rules, and planning for market-making failures, would reduce the need for emergency interventions when correlation breakdowns compress the option set.
Related reading
- Correlation vs. Diversification: Rethinking Risk in a Complex Market Landscape
- Stress Testing Your Portfolio: Assessing Vulnerabilities in a Volatile Market
- Behavioral Biases in Times of Market Stress: Lessons from Recent Crises
- Decision-Making Under Uncertainty: Practical Techniques for Investors in Volatile Markets