Markets do not move only on cash flows and discount rates. They also move on stories, fear and pride. Behavioral economics gives us a map of those forces. It also shows the marks they leave on prices and portfolios.
This article is a field guide to that map. It links core ideas to what we saw during the pandemic shock, the retail wave, and the social web’s new speed of sentiment.
What behavioral economics brings to investing — core concepts and mechanisms
Investors compare outcomes to a reference point, not to a neutral scale. Losses loom larger than gains of the same size. That shapes risk taking around that point. That is the essence of loss aversion and reference dependence described in prospect theory.
Overconfidence matters just as much because people overrate their skill and underweight how noisy the world is. That boosts trading and conviction. Extrapolation plays a role too. Investors project recent returns forward and chase trends when times feel good.
These traits are not just folklore. A broad review of psychology‑based models links overconfidence, prospect‑theory framing and extrapolation to patterns in mispricing, momentum, and trading volume. It also gives testable predictions for markets, as summarized by NBER research on psychology and asset prices.
Probability weighting adds a final twist. Investors may overpay for lottery‑like payoffs while underpricing more likely outcomes. That helps explain bursts of demand for attention‑grabbing assets and the occasional neglect of steady winners.
From minds to trades to prices
Loss aversion encourages selling winners too soon and holding losers too long. Overconfidence raises turnover and pushes people into concentrated bets. Extrapolation fuels momentum and then drives reversals when the story exhausts itself.
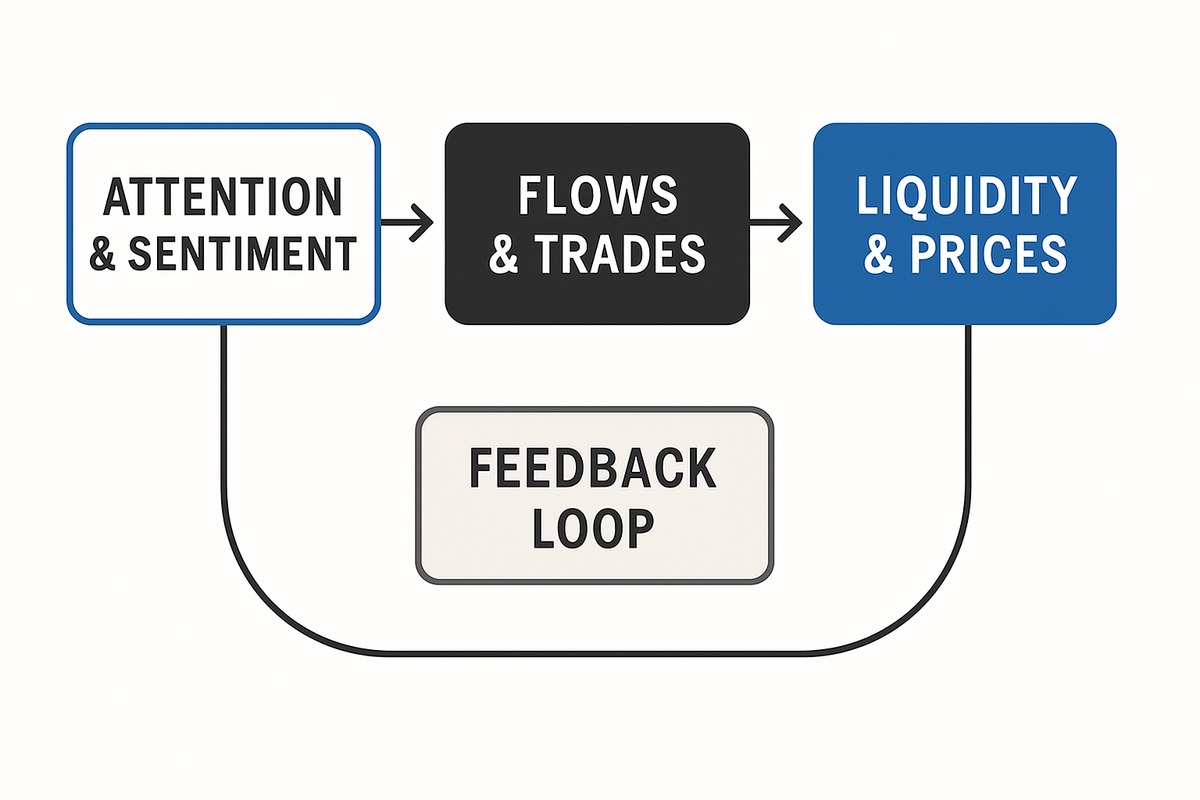
The jump from bias to market impact follows through flows and liquidity. Crowds tend to move in the same direction. Market makers update quotes to match that pressure. The result can be trend reinforcement, transient mispricing and volume spikes that later fade.
When attention swings, valuation tools struggle to anchor prices. That mechanism is not mystical. It is measured in trading records and order books. Psychologically driven trades aggregate and meet the constraints of market structure.
These pathways do not erase fundamentals. They distort the path along which fundamentals get reflected in prices. That often happens at the worst possible time for an undisciplined investor.
| Bias / Mechanism | Typical investor action | Market fingerprint |
|---|---|---|
| Loss aversion, reference point | Hesitate to deploy after drawdowns, sell winners early | Under‑investment after declines, muted re‑risking |
| Overconfidence | Trade more, concentrate bets | Higher turnover, wider dispersion of outcomes |
| Extrapolation | Chase recent winners | Momentum, flow‑driven price pressure |
| Probability weighting | Seek lottery‑like payoffs | Demand spikes in attention assets |
| Limited attention | Miss slow shifts in risk | Delayed reactions, abrupt catch‑ups |
Why this matters now: technology, retail flows and pandemic shocks
The investor base changed during the last cycle. A rise in retail trading, new trading apps, and social media amplification made sentiment shifts faster and more visible. The Federal Reserve documented how episodic retail herding around meme stocks shaped price action, with a limited but non‑negligible footprint for financial stability, in its 2021 Financial Stability Report.
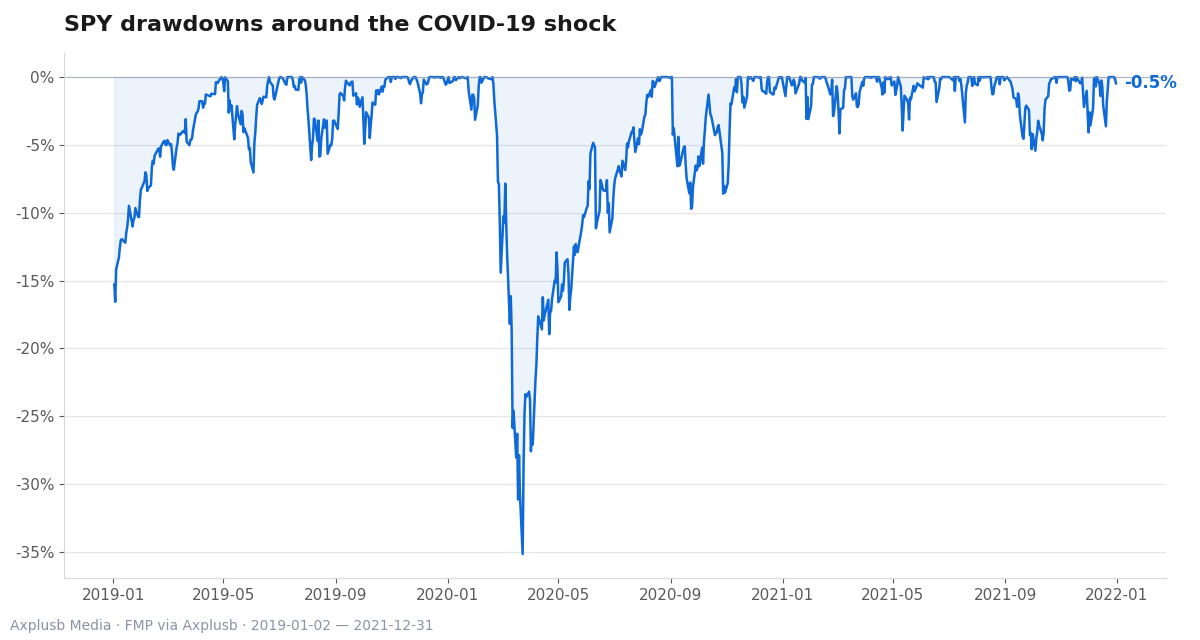
The pandemic added a stress test for market plumbing. Liquidity dried up in places where it felt abundant just weeks earlier. The need for cash drove abrupt reallocations. That shock interacted with beliefs, attention, and constraints on dealers and funds.
Prime money market funds faced heavy redemptions from large investors in March 2020. Fund managers sold less liquid holdings to meet withdrawals. That amplified market liquidity stress, according to the BIS analysis of March 2020 money market stress.
Policy communication mattered just as much as policy size. A large asset manager’s 2020 review noted that signaling helped calm sentiment. It also said market design ideas targeted points of fragility. Those observations connect the human part of markets to the institutional levers that can steady it.
From psychology to prices: observable market fingerprints
The bridge from bias to price is empirical. Psychology‑based models link belief errors and framing to momentum, reversals and excess trading volume. They frame these as testable predictions for data, as the NBER review on psychology and trading volume explains.
Beliefs diverge and attention is scarce. Research summarizing portfolio behavior shows that belief heterogeneity and limited attention shape allocations and flows. Those allocations and flows in turn move returns. That mix explains why some investors chase the same story while others miss it entirely.
Overconfidence does not stay isolated. It can spread across groups and organizations. That can synchronize decision errors and raise the odds of coordinated mispricing. This social channel helps to explain bubbles and sharp fads when confidence feeds on itself.
You can see the fingerprints in trade data and price paths. Flow‑driven rallies extend beyond fundamentals. Liquidity gaps open when people all reach for the same door, with volume surges clustering around attention events. Each element fits a pattern predicted by the behavioral models.
For a deeper view of how these fingerprints show up across cycles, see Behavioral Biases in Times of Market Stress: Lessons from Recent Crises.
Common misconceptions and dangerous simplifications
First, retail activity is not destiny. Episodes of social‑media herding can be dramatic and short‑lived. The systemic footprint is limited but not zero, as the Federal Reserve discussion of meme stocks notes.
Second, loss aversion is not the only reason selloffs accelerate. Liquidity constraints, institutional mandates and limited attention all add fuel. Extrapolation of bad news can freeze buyers. A single bias story misses the layered reality of how markets clear.
Third, “buy the dip” is harder than it sounds. Timing requires fighting loss aversion and status‑quo comfort. It often meets execution frictions and headline noise. Many investors delay and miss the re‑risking window. Mainstream advisory research discusses this when weighing timing against discipline.
Finally, the presence of bias does not imply easy alpha. The edge depends on tools, patience and constraints, not just on spotting the human flaw. A trading rule without a plan for liquidity and narrative risk is only a story.
If you want a framework to turn these cautions into screens and alerts, explore Understanding Market Trends Through Behavioral Analytics.
Case studies: March 2020 liquidity stress, meme episodes, and policy responses
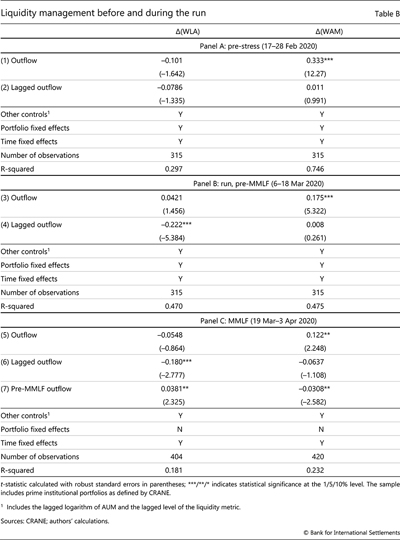
In March 2020, stress hit short‑term funding hard. The BIS documents how large investors redeemed from prime money market funds. It also shows how managers sold less liquid assets to meet outflows. That combination raised market dysfunction when it was least welcome, as the BIS Quarterly Review case study details.
This is a textbook feedback loop. Redemptions forced sales, sales widened discounts and wider discounts sparked more redemptions. The loop tied investor behavior to price dynamics and to the hidden plumbing of liquidity.
Meme episodes tell a different story. The Federal Reserve’s 2021 report highlights social‑media‑driven trading in specific equities and options and herding bursts among retail investors. It concludes the broader stability impact was limited but worth monitoring, per the Financial Stability Report overview.
Policy signaling then met market design. A 2020 practitioner review emphasized how clear signals helped calm sentiment during the pandemic. It also suggested structural fixes to reduce fragility in the future. The lesson is the same across episodes because beliefs and structure interact in both directions.
Counterarguments and alternative interpretations
Belief heterogeneity cuts both ways. It fuels fads when many extrapolate. It dampens them when enough investors think differently or have different constraints. That diversity of views and limits explains why some mispricings persist while others fade fast.
Attention is scarce and experience shapes it. Investors who lived through specific drawdowns respond differently to new shocks. That affects both their demand for risk and their timing. This mix can slow the spread of a fad or leave a pocket of the market exposed.
Institutional features can mitigate bias. Mandated diversification, risk controls and rebalancing rules pull portfolios back toward discipline when emotions push hard. Market structure can absorb one‑sided order flow or fragment it across venues. That changes how prices adjust.
Behavioral economics is not a master key. It is a set of tools that interact with plumbing and policy. It is strongest when it makes sharp, testable predictions. That is why the better work ties a specific bias to a measurable pattern you can check.
Practical implications for investors and policymakers
For investors, discipline beats episodes. Rules that automate re‑risking and rebalancing cut the chance that loss aversion and overconfidence take the wheel when stress hits. Systematic dollar‑cost averaging and scheduled rebalancing anchor decisions when stories get loud.
Market‑timing sounds bold, but it is costly in practice. Advisory research ahead of the pandemic made the simple case that waiting for a better entry often fails because fear and status‑quo bias block action. Doing the boring thing on time turns out to be a strong edge.
For policymakers, communications are instruments. Clear signals can calm disorder when it is driven by narrative and coordination rather than by solvency. A 2020 practitioner review described how policy signaling helped soothe markets. It also showed how design fixes targeted known fragilities in market functioning.
Liquidity backstops and transparency help, but they are not free. The BIS case shows how liquidity mismatch and investor size matter during stress. That points to ongoing design trade‑offs. The goal is to reduce feedback loops between redemptions, fire‑sales and market dysfunction, as the BIS analysis of MMF stress underscores.
Check how disciplined your portfolio really is. A simple audit of rules, gates and triggers can reveal more than a new signal ever will.
Tools, diagnostics and further reading for implementation
Diagnostics should be clear and repeatable. Track flows into high‑attention assets, dispersion across belief‑driven segments, and realized turnover against plan. Monitor liquidity indicators that tighten before stress and note where funds hold less liquid paper.
Pay attention to belief proxies. Search trends, positioning surveys and cross‑asset spread moves often rhyme with the psychology playbook. They are not oracles, but they can flag when extrapolation and overconfidence are likely to dominate.
Use a checklist that ties evidence to action. Map each bias to one or two observable metrics and a pre‑set response. The point is to replace ad‑hoc timing with a small number of simple, robust habits.
For a broader tour of how these diagnostics fit with portfolio design, see Understanding Behavioral Traps during inflationary periods.
- Define rebalancing bands and calendar dates, and stick to them.
- Set maximum turnover for each strategy; investigate any breach.
- Track liquidity buckets, and cap exposure to less liquid assets.
- Add a pre‑commitment to deploy cash when drawdowns hit plan thresholds.
If you prefer to build with factors instead of stories, our guide to structured signals connects these ideas to the factor world. It shows how discipline and simple rules can beat strong emotions in live markets.
Take ten minutes to write down your next bear‑market playbook. Your future self will thank you when the screen turns red.
Related reading
- Behavioral Biases in Times of Market Stress: Lessons from Recent Crises
- Understanding Market Trends Through Behavioral Analytics
- Understanding Behavioral Traps: How Investor Psychology Influences Market Reactions During Inflationary Periods