Political shocks used to feel like background noise. Today they cut through prices, margins and liquidity almost at once. European investors do not need more drama — they need a way to turn headlines into decisions they can defend.
What “political uncertainty” means in practice
Political and geopolitical risk can be measured, not just sensed. Two research streams have changed the game by turning news into numbers that map onto asset returns.
The first is the news‑based Economic Policy Uncertainty index, introduced by Baker, Bloom and Davis. It shows that higher policy uncertainty links to higher equity volatility and to weaker investment and jobs. The effect is stronger in policy‑sensitive sectors, and the index gives investors a validated shock proxy they can use in tests the Economic Policy Uncertainty index.
The second is the Geopolitical Risk index. It parses press coverage of threats, tensions and conflict. Caldara and Iacoviello show that higher geopolitical risk tends to foreshadow lower investment and hiring. They also find it raises downside tail risks for markets and that exposures vary by industry and firm, which matters for sector tilts and hedges the Geopolitical Risk index.
These indices do not predict events. They give you a way to turn “what if” into ranges and to track how stress spreads as the news changes. They also let risk teams speak the same language as boards and regulators.
Why this matters now for European portfolios
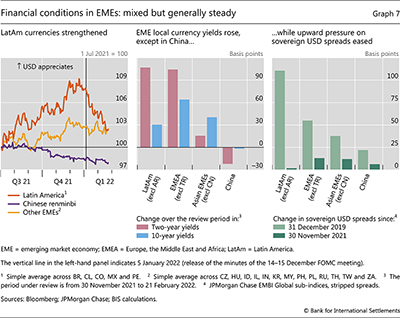
The case for doing this work has hardened. Recent geopolitical escalations produced fast jumps in volatility, credit protection flows and currency moves. They hit hardest where exposures were local.
The Bank for International Settlements documented these jolts around the Russia–Ukraine episode. It found spikes in equity and rates volatility, dislocations in FX, and surges in CDS demand. Effects were stronger near the epicentre and in concentrated exposures the BIS Quarterly Review evidence.
Euro‑area policy voices have also stressed the macro channels. The European Central Bank’s 2024 stability work links geopolitical shocks to higher inflation pressure and weaker industrial output. It calls for stress tests that reflect those channels for banks and markets.
Practitioners add a sober note. J.P. Morgan’s mid‑year outlook argues that political risk is pervasive yet hard to “hedge away”. It recommends selective risk taking, diversification and active use of alternatives to handle idiosyncratic exposures.
How shocks travel from headlines to returns and jobs
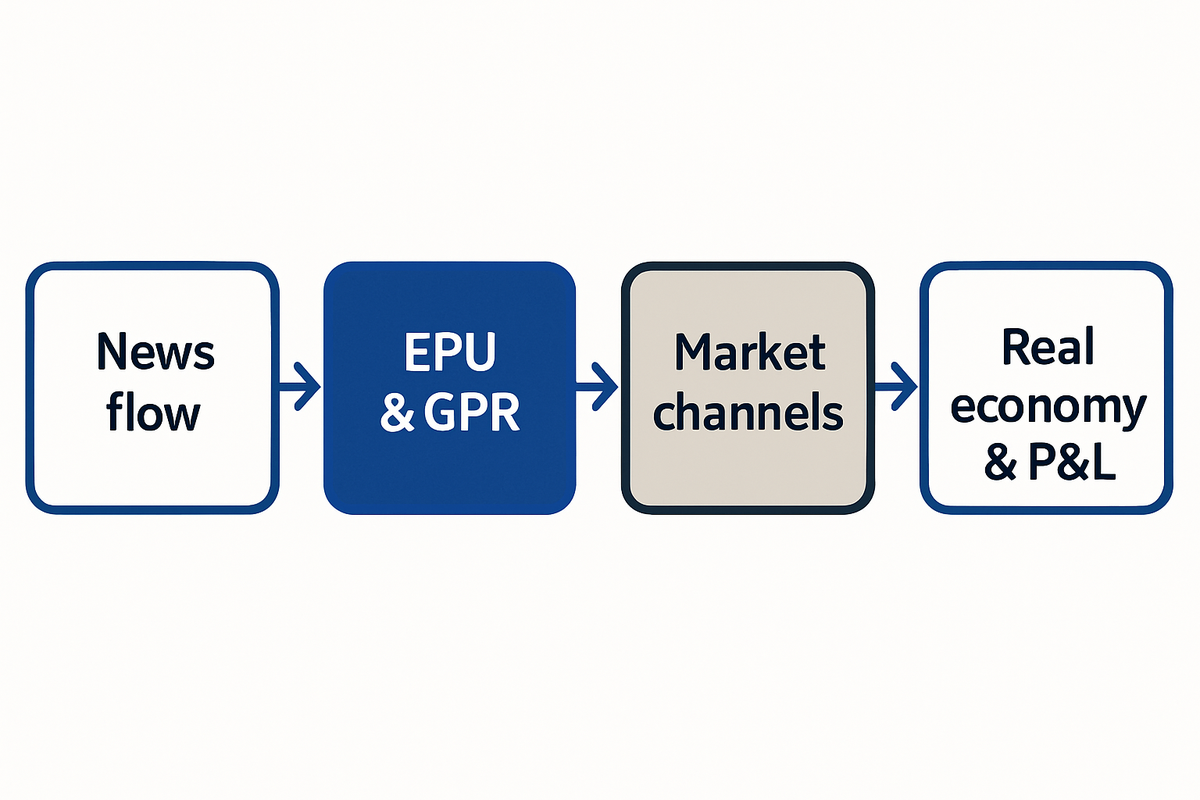
Uncertainty works through equity volatility first. When policy risk rises, equities swing more. Firms pull back on capex and hiring. EPU work shows these effects are larger in policy‑sensitive sectors.
Geopolitical risk adds a tail component to that path. The GPR research shows industries with higher exposure to trade routes, energy inputs or sanctions screens feel a sharper hit to expected investment and job plans. That can bleed into cash flows and valuations.
Market plumbing can amplify the move. The BIS described FX basis shifts, wider bid–ask spreads and heavier CDS flows during Europe‑centric shocks. Those shifts can turn a macro hit into funding stress for exposed names.
The ECB traces the loop to the real economy and highlights channels that run through banks’ capital, market liquidity and inflation. These channels can raise risk premia and depress output at the same time. That is a poor mix for risk assets.
A practical measurement toolkit
Good risk work starts with inputs you can defend. Investors should combine simple, proven indices with formal frameworks that link news events to market prices.
Use the EPU and GPR indices as shock triggers and state variables. They help define when a scenario starts, how it unfolds and which sectors are most sensitive.
Adopt a framework that ties headlines to the tape. BlackRock’s Geopolitical Risk Indicators and its market‑driven scenarios map around two thousand market variables to risk events. They emphasise that impacts are larger near the epicentre and when the macro backdrop is weak.
Align macro assumptions with the euro‑area policy view. The ECB’s geoeconomic composite and its stress‑testing channels help you link political shocks to inflation, output and credit tightness across the single market. That brings supervisory discipline into the exercise.
For teams that use data science, there is more to build. See how we apply machine learning to live risk signals in The Rise of AI in Risk Assessment. See how those feeds slot into decision loops in Decision-Making Under Uncertainty.
| Input or framework | What it measures | How to use it | Why it matters |
|---|---|---|---|
| EPU index | Policy uncertainty in news | Trigger scenarios, size equity vol shocks | Links uncertainty to vol, investment and jobs |
| GPR index | Geopolitical risk in news | Flag tail risk regimes, set sector weights | Captures downside tails and exposure gaps |
| BlackRock BGRIs/MDS | Market-priced risk mapping | Bridge narratives to P&L moves | Tests if risk is already in prices |
| ECB geoeconomic composite | Macro channels from shocks | Align inflation and output paths | Matches supervisory stress templates |
| BIS event evidence | Liquidity and basis stress | Calibrate CDS, FX and vol jumps | Sets realistic, localised shock sizes |
From indices to P&L: building scenarios and stress tests
Start with a narrative. For example, an escalation that raises GPR, hits European energy inputs, lifts the euro area’s inflation path and weakens output. Then translate it into numbers.
Use EPU and GPR levels and changes for the headline shock. Reflect sector and location sensitivity using the GPR evidence on firm‑level exposures. Layer in stronger effects near the epicentre.
Set shock sizes with market evidence. The BIS review helps calibrate jumps in volatility, CDS spreads and FX. It shows how funding conditions can turn quickly when exposures cluster.
Bridge to macro with templates. The ECB’s work gives you plausible inflation and industrial output paths under geopolitical stress. You can pipe those paths into equity, credit and rates models and across bank exposures.
Finally, test the “is it priced” question. BlackRock’s market‑driven scenarios help compare current prices to implied risk premia. They steer you between over‑hedging and under‑preparing.
Portfolio‑level mitigation: diversification, liquidity and active tilts
You cannot hedge all political risk. Practitioners urge focus. Take the risks you are paid for and shed the ones you are not.
Diversify by exposure, not by label. Mix assets with different policy and trade linkages. Use alternatives where they smooth idiosyncratic political swings, in line with the J.P. Morgan guidance.
Keep liquidity plans simple and pre‑agreed. The BIS evidence on FX and CDS strains shows how fast basis and funding can move. Decide in advance what to sell, where to fund and how to roll.
Use active tilts when pricing gaps open. The BlackRock framework suggests that when market prices over‑ or under‑shoot the risk, tactical positions and hedges can add value. Do this only if you cost the carry and the slippage.
Check how disciplined your portfolio really is.
Tail‑hedge design that fits European shocks
Tail hedges come in two broad types. Put‑like strategies seek convex payoffs in sharp drawdowns. Trend‑like strategies aim to catch persistent down moves across assets.
The AQR research weighs the trade‑offs. Put‑like hedges can deliver strong convexity but carry a long‑run drag when markets are calm. Trend‑like hedges have lower drag and can protect across more tail types, but they may lag in gap‑down events.
A blended approach often works best. Combining a budgeted sleeve of put‑like protection with a core trend‑like allocation can raise the chance that at least one engine works across geopolitical shock styles. It can also smooth the total hedge cost.
For deeper techniques and cost control ideas, see Navigating Tail Risk in Uncertain Markets.
Case evidence: what recent shocks taught us
Events around Russia–Ukraine delivered a live test. Markets saw rapid spikes in volatility, currency dislocations and heavy CDS flows. The pain was greater where exposures were local and concentrated, as the BIS documented.
Policy risk added to the mix. The EPU research shows that when policy uncertainty rises, firms cut back on investment and hiring. That can amplify equity and credit stress in policy‑sensitive sectors during a geopolitical flare‑up.
The GPR findings show that the hit is uneven across firms and industries. Exposures to trade choke points, energy inputs and sanction risks became valuation drivers overnight. They shaped which hedges paid.
The ECB’s macro lens helps explain the path: inflation pressure rose even as industrial output weakened. That is a poor backdrop for both bonds and equities and it puts more weight on liquidity and hedging plans.
Misconceptions that hold portfolios back
“Political risk is already priced.” Sometimes it is, often it is not. BlackRock’s market‑driven scenarios exist to test this claim. Price the gap, do not assume it away.
“Hedging is wasted carry.” AQR’s work shows that hedge drag is real, but it can be budgeted and cut with blended designs that protect across more tail types, keeping the payoff per unit of cost sensible.
“Nothing helps when shocks hit.” The BIS evidence on local amplification and the ECB’s channels show plenty of levers that change outcomes. These levers include sector weights, location exposure, liquidity and funding, and the specific hedge mix.
“The only answer is passive patience.” J.P. Morgan argues for selective risk taking and for using alternatives and active tilts to handle idiosyncratic exposures. Discipline beats a shrug.
Run a quick rehearsal of your liquidity plan.
A checklist you can put to work this quarter
This does not need a six‑month build. A small team can stand up a minimal, defensible framework now, then refine it as data and process mature.
- Integrate EPU and GPR feeds to mark regimes, trigger scenarios and set sector sensitivity.
- Build market‑driven scenarios that link narratives to price moves, and align macro paths with the ECB’s geoeconomic channels.
- Calibrate equity, credit and FX shocks with the BIS event evidence, and reflect local amplification where exposures cluster.
- Set allocation tilts and pre‑plan liquidity triggers, then design a blended tail‑hedge sleeve that balances convexity and drag.
- Review each month what was priced, what was not, and re‑cost the hedges — then adjust positions and buffers.
If you want a broader blueprint for data and process, see how we connect models and teams in The Future of Finance: Integrating AI into Risk Management Frameworks.
Related reading
- Assessing Portfolio Risk in an Era of Geopolitical Uncertainty
- Navigating Tail Risk in Uncertain Markets: Advanced Strategies for Portfolio Protection
- The Rise of AI in Risk Assessment: Transforming How Investors Approach Uncertainty
- The Future of Finance: Integrating AI into Risk Management Frameworks