Fear and greed are old words for familiar urges. Markets just make them visible in prices, volume, and headlines. In volatile stretches, those urges meet belief updates, rules, and institutional process. The result is not noise, it is structure.
Framing fear and greed: what we mean and why psychological preferences matter
Fear in markets is the preference to avoid losses even when the odds favor risk. Greed is the preference to chase gains even when the payoff no longer justifies the risk. Both are shaped by reference points, the mental anchors that define what a “loss” or a “gain” is to an investor. In a drawdown, the anchor is often yesterday’s high.
Prospect theory formalizes these preferences. Losses hurt more than equal sized gains help, and outcomes are judged versus a moving reference point. Formal asset pricing work shows that such loss aversion and reference dependence can raise average returns, increase volatility, and create predictable patterns in prices, as argued in Prospect Theory and Asset Prices.
This is not a curiosity of lab studies. It maps to trading. Investors anchor on recent peaks and feel the sting of paper losses. They sell to relieve pain or double down to erase it, even when expected values say pause.
Fear and greed also travel in crowds. That is why we see surges in turnover and streaks of one way price action. We covered those flows in our look at lessons from recent market events.
The behavioural mechanics: loss aversion, overconfidence, extrapolation and herding
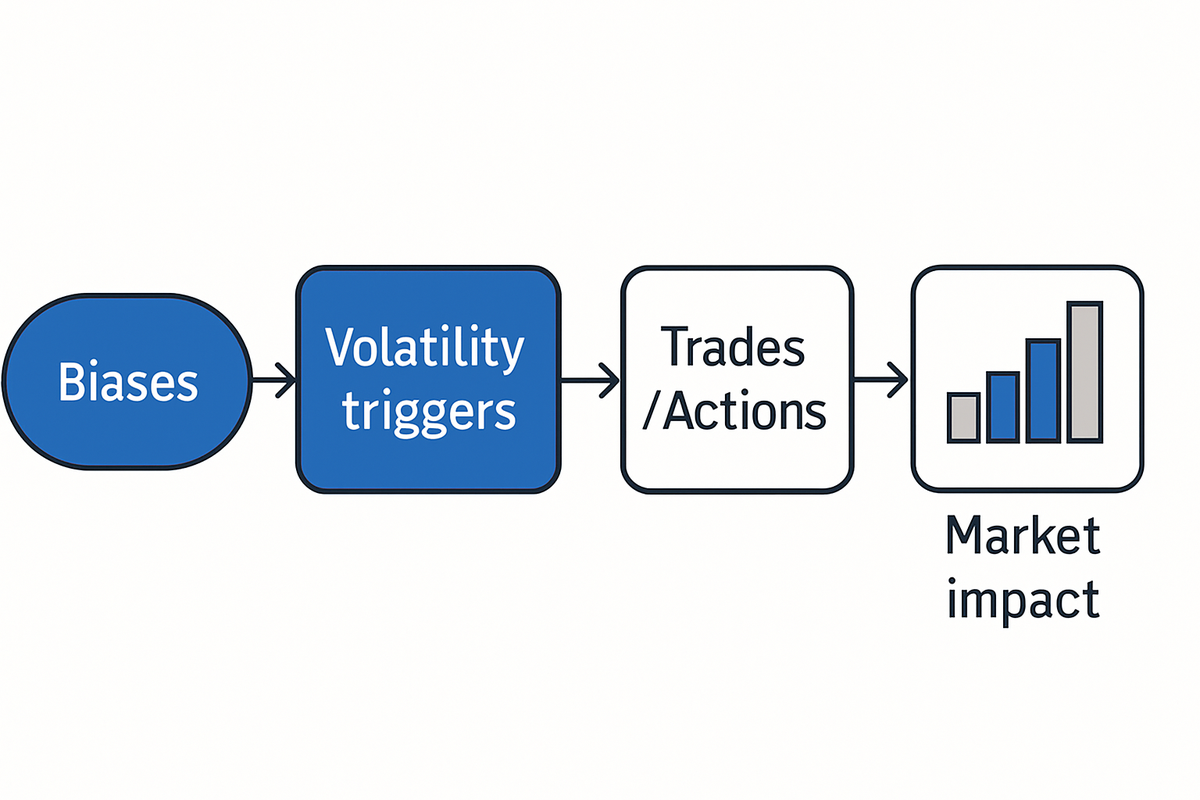
Loss aversion is the lever that turns a small drawdown into a big decision. The utility drop from a 5% loss often feels larger than the satisfaction from a 5% gain. When volatility rises, that pain response becomes frequent and salient. Selling becomes relief.
Reference dependence explains why the same price can feel safe to one investor and risky to another. If your anchor is an all time high, a modest rally still feels like a hole. If your anchor is the lows, the same price feels rich. Preferences become path dependent.
Overconfidence is the engine of quick conviction. Investors overrate their signals and underweight error. That accelerates buying when prices rise and accelerates selling when they fall. Extrapolation follows, as many expect recent returns to continue longer than they should.
Herding reduces the sense of regret. People look to others when uncertainty is high, and volatility raises that urge. Clusters of similar decisions appear, which strengthens the price move and validates the crowd. Volume spikes, then fades only after the anchor moves.
From bias to trade: a compact map
Biases meet triggers and turn into trades. The path is simple, but the mix matters. In practice, several biases act at once.
| Bias | Volatility trigger | Typical trade or inaction | Likely price impact |
|---|---|---|---|
| Loss aversion | Drawdown from recent peak | Sell winners late, cut losers | Sharp down moves, weak rebounds |
| Reference dependence | New high or new low | Anchor on recent price | Sticky ranges, gap risk |
| Overconfidence | Fast rally or selloff | Bigger positions, quick flips | Overshooting, whipsaws |
| Extrapolation | Multi-week trend | Chase momentum | Trend persistence, crowded exits |
| Herding | Consensus headlines | Copy dominant flow | One-sided order books |
None of these require a villain. They arise from the way we feel about gains and losses. They matter more when information is noisy and time is short.
Volatility, beliefs and delayed reactions: why fear can persist and then overcorrect
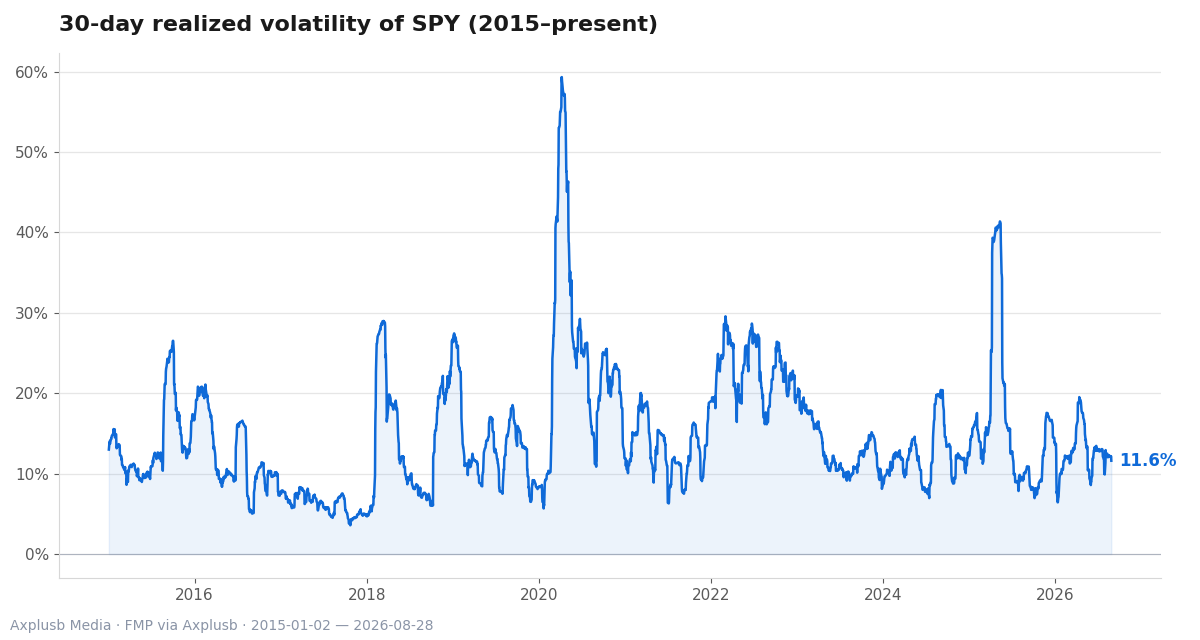
Beliefs about risk do not update as fast as prices. Investors often adjust their expectations of future volatility slowly, then correct in a rush once the new regime becomes obvious. Underreaction can let a shock echo for weeks.
Delayed overreaction often follows. Position sizes, hedges, and risk limits get reset after the move has already hurt. That produces a second wave of selling or buying. The move looks like a surprise, yet it is the lagged response of many balance sheets.
The link to fear and greed is tight. When fear sets the new anchor, higher expected volatility feels like the norm. Investors demand a bigger premium to hold risk assets. Later, when realized risk starts to fall, greed grows again and the unwind can look abrupt.
Composite sentiment gauges often co-move with realized volatility and tail behavior. Their readings tend to be most powerful during crises. They are not oracles, but they can map the emotional temperature that sets near term trading ranges. That is why they appear in dashboards next to earnings and spreads.
We have traced this ebb and flow in our piece on investor sentiment cycles and saw how cycles extend far beyond a single headline.
Where fear and greed bite hardest: the market segments most sensitive to sentiment
Not every stock is equally exposed to the crowd’s mood. Small, young, hard to value, and volatile firms are more sensitive to investor sentiment. When fear rises, these names can fall further and faster. When greed runs, they can lead the rally.
This is not only trader lore. A classic survey of sentiment shows that these characteristics make a stock more dependent on mood rather than cash flow news. The effect is clear in the cross section of returns, as documented by Investor Sentiment in the Stock Market.
Why does sensitivity cluster there. Valuation is uncertain and narratives are strong. Price discovery has fewer anchors in hard data and more in expectations about future growth. That gives fear and greed room to move prices.
For allocators, the lesson is practical. Know where your portfolio is exposed to mood. Stress test the parts that lack hard anchors. Do not be surprised when they swing.
Evidence and institutional practice: indicators, models and portfolio responses
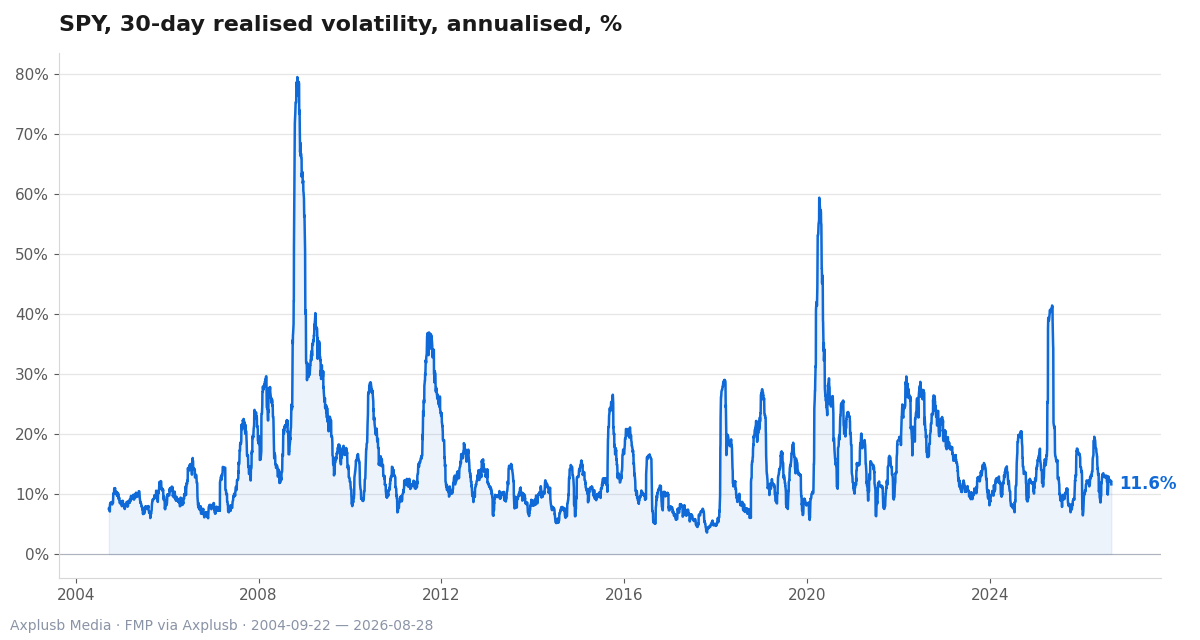
Sentiment indicators are not just media toys. Composite indices can track the realized shape of returns, including volatility and the thickness of tails. Their signal-to-noise is higher when markets are stressed. Their value is lower in quiet ranges.
Large managers now embed such gauges into systematic models. They mix text, flows, and options data to proxy mood. The goal is simple. Reduce human bias and translate emotion into transparent inputs that can be handled by rules.
An institutional white paper describes how process can tame the cycle. It details how data growth allows models to capture sentiment and improve short horizon forecasts for factor returns. The claim is not universal alpha, it is a tool for timing and risk control, as argued in Systematic investing — Designed for a new frontier in data availability.
Risk management overlays complement this approach. Drawdown controls aim to cap peak to trough losses that trigger panic selling. Tail hedges seek to buy convexity when fear is cheap. Both reduce the need to react under stress.
We have seen how these ideas meet practice in our work on behavioral analytics. Models are not a cure. They are guardrails that keep the car on the road when the light fades.
How signals become decisions
– Define the mood: combine survey, price, and options data into a stable sentiment score.
– Map to actions: link thresholds to clear changes in exposure, hedge ratios, or factor tilts.
– Test the horizon: use sentiment for near term shifts, and keep long term anchors on fundamentals.
– Close the loop: review behavior after each shock and refine triggers to cut false alarms.
Common misconceptions and constructive scepticism
Misconception one is that sentiment predicts markets on its own. It does not. It interacts with valuation, liquidity, and policy. Think of it as a short horizon risk thermometer, not a valuation model.
Misconception two is that indicators beat fundamentals in all regimes. They do not. Most sentiment signals decay fast and can reverse with little warning. That is why they are better at helping with entries and exits than with long horizon allocation.
Another trap is to ignore the time it takes for beliefs to change. Models of behavior point to slow and state dependent learning. That creates windows when a reading stays extreme yet prices drift the other way. Patience is part of the design.
Institutions also warn that process, not prediction, is the main edge. One large manager reports that sentiment can help forecast factor returns over short horizons, but only as part of a broader, disciplined framework, as described in the BlackRock white paper.
Practical toolkit: rules, processes and instruments to manage fear and greed
Start with simple rules that you can follow when screens are red. Pre‑set rebalance bands, scheduled review dates, and clear sell disciplines remove the heat of the moment. They also stop drift into accidental bets.
Automate where you can. Use standing orders, model portfolios, or rebalancing tools to enforce the plan. If you measure yourself, add a line for “decisions made during stress” and aim to reduce that count over time. Process is a habit, not a memo.
Layer sentiment thoughtfully. Use composite gauges to scale exposure within bands rather than to flip the portfolio. Tie signals to small, repeatable actions. Keep a diary of decisions and the signals you used.
Control drawdowns. Set portfolio level brakes that reduce risk when losses breach a threshold. Consider tail hedges that pay in deep selloffs. Both tools reduce the urge to capitulate near the low.
Align horizon and instrument. Short horizon signals are for liquid sleeves and hedges. Long horizon allocations should stay anchored to cash flows and valuation. Match the tool to the task.
Check how disciplined your portfolio really is. Test your process before the next spike in volatility.
A concise checklist you can use tomorrow
- Define your reference point: last rebalance level, not last high.
- Pre‑commit to rebalance bands and review dates.
- Use one composite sentiment gauge to scale risk, not to time the top or bottom.
- Cap single‑day decision size to avoid panic trades.
- Add a portfolio drawdown brake and document the trigger.
- After stress passes, review what worked and what did not.
Conclusion: what to monitor and the tradeoffs ahead
Fear and greed are not quirks. They are features of how we value gains and losses through time. Prospect theory gives the language and the mechanism. Markets amplify the result through volume, herding, and slow belief updates.
What should you watch. Keep an eye on composite mood, on the parts of your portfolio that are hard to value, and on any drift away from process. Use sentiment for near term sizing and hedges. Use fundamentals for where you own risk.
What are the tradeoffs. Signals can reduce mistakes in the heat, but they can also add churn. Process can dull the sting of drawdowns, but it can also mean missing a last burst of a rally. There is no way to eliminate fear and greed, only to channel them.
Institutions now blend data and rules to help. They have shown that sentiment can help at short horizons and that risk brakes keep people in their seats. Individual investors can borrow that toolkit in simpler form and avoid paying tuition to the cycle.
Related reading
- Investor Sentiment: How Emotions Drive Market Cycles
- Understanding Market Trends Through Behavioral Analytics
- Behavioral Economics and Investment Performance: Lessons from Recent Market Events