Corrections hurt twice. First, in mark‑to‑market losses. Then in the choices we make when fear and pride crowd the screen. By “cognitive biases in market corrections,” we mean the stable ways our minds misread falling prices, reframe risk, and mistime exits.
The thesis is simple. Individual psychology explains many of the most costly timing errors. These errors are predictable, and therefore manageable, if you respect how reference points shift and why losses loom larger than gains, as described in Daniel Kahneman’s prospect theory. A formal model shows how this plays out at the decision edge — when to stop or keep holding — and how much performance a biased rule can leave on the table, relative to a rational one, in a 2021 arXiv paper by Kleinberg, Kleinberg, and Oren.
Executive summary
Corrections compress time. Prices fall, news accelerates, and the investor’s frame narrows. In that tunnel, two features govern action — loss aversion and shifting reference points. Losses feel larger than equal gains, so we demand too much to accept pain. Reference points move with the market or with our prior high‑water marks, which quietly resets what we consider “getting back to even.”
The result is a pattern. Investors hold losers too long, sell winners too early, and exit the market at the worst time. The Kleinberg‑Kleinberg‑Oren model formalizes this stopping problem under bias and shows why rules that look rational in calm states become inconsistent during drawdowns.
The goal of this piece is not to cure biases. It is to build a decision layer that anticipates them and reduces damage when prices fall. Process can be designed to carry you through the emotional part of a correction.
Why this matters now
The economic cost of panic selling is real, not theoretical. J.P. Morgan Asset Management’s long‑run data show that staying invested has historically beaten parking in cash, and that missing recoveries is the key penalty of reactive exits, as summarized in their “Staying Invested” analysis.
The systemic layer matters too. When many investors run the same risk‑sensitive playbook, selling can synchronize. Institutional practices that tie leverage or risk budgets to recent volatility can force waves of de‑risking. That is how individual bias and mechanized discipline interact to deepen a correction.
Social and media feedback loops amplify the effect. Coverage shifts from context to narrative and from probabilities to certainties. The investor facing a red screen finds many reasons to act now, and few to wait.
The behavioural mechanics that drive corrections
The same small set of biases repeat in most corrections. They often arrive in a sequence that feels rational but is, in fact, reactive. A quick taxonomy helps you recognize the drift before it becomes an action.
Start with framing. A loss framed against last month’s high feels different from the same loss framed against your long‑term plan. Shift the frame, and behaviour shifts with it.
Loss aversion and shifting reference points
Prospect theory highlights two core ideas. Outcomes are evaluated relative to a reference point, and losses weigh more than gains. That structure explains why a 10% drawdown can trigger demands for very large rebounds before we feel “whole” again.
In declining markets, the reference point often drifts from goals to break‑even anchors. The Kleinberg‑Kleinberg‑Oren model shows how such shifting benchmarks, combined with loss aversion, lead to suboptimal stopping rules in dynamic settings, as detailed in their arXiv paper on behaviorally biased stopping.
The practical effect is delay. Investors keep losers longer than is justified by their plan, then capitulate after much damage. The pattern is predictable, which means a rule can be designed to counter it.
Recency, confirmation and the disposition effect
Recency bias makes the latest price move feel like the new regime. Confirmation bias then filters the flood of data to match the mood. Together they produce quick, confident narratives.
Practitioners see a specific variant — the disposition effect. Winners are realized to “lock in gains,” while losers are kept to “avoid admitting a mistake.” BlackRock’s advisor playbooks catalogue these patterns and offer simple interventions to slow reactive selling in volatile weeks, as outlined in their psychology of investing resource.
Morning routines change in corrections. Investors check accounts more often and react to intraday swings. That tighter feedback loop raises the odds of a costly click.
Overconfidence, FOMO and panic‑selling
Overconfidence shows up as an urge to take control at exactly the wrong time. It can coexist with fear. When prices slide, the overconfident investor believes they can time the exit and re‑entry, which increases the chance of a late sell.
Education helps, but it is not a shield by itself. Survey evidence has linked higher overconfidence to a greater likelihood of panic selling, with financial literacy sometimes failing to offset that effect. That is why process must sit beside knowledge.
FOMO matters even in sell‑offs. It flips sign. Investors fear missing the “last chance to get out,” which compresses decision time and increases error rates.
How individual biases aggregate into market‑level crises
Bias is personal, yet markets are social systems. Herding can start with individuals watching each other, then scale through institutions that share models and mandates. The boundary from micro to macro is crossed when similar risk engines meet a sharp move.
Risk‑sensitive constraints translate volatility into position changes. If value‑at‑risk or drawdown limits tighten with falling prices, selling begets selling. Crowded trades can unwind in sync, which produces feedback loops that look like macro news but are, in part, position mechanics.
Narratives accelerate the loop. Social proof persuades fence‑sitters that “everyone is exiting.” Content with high emotional charge travels further, and the market absorbs that energy. A local correction broadens into a systemic event.
Empirical signals and costs
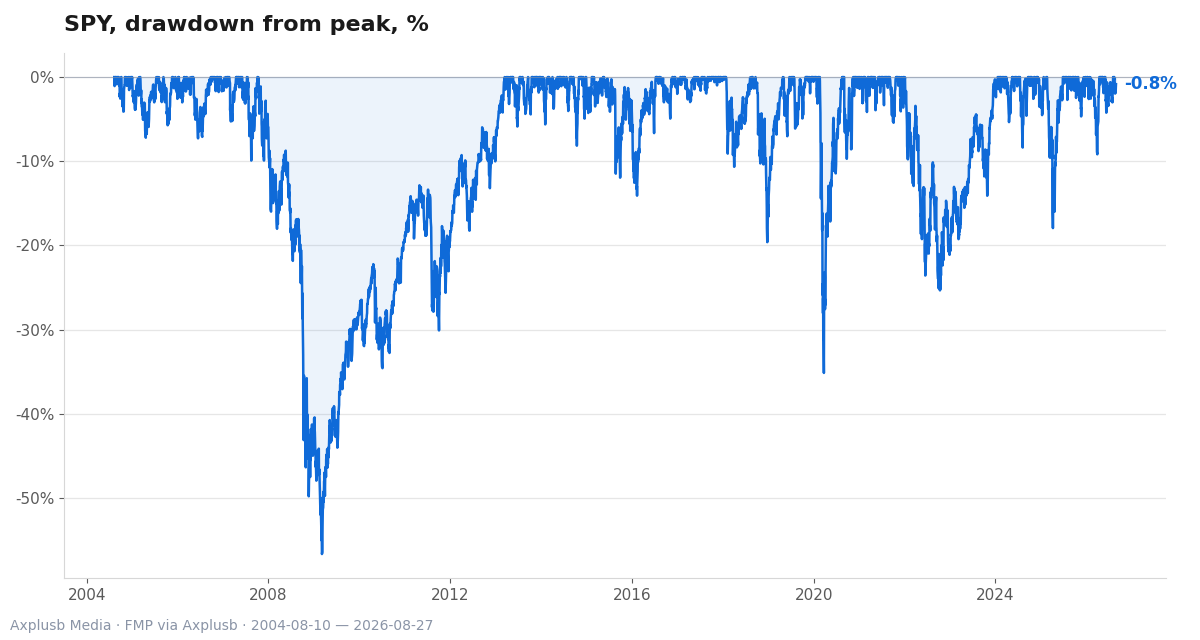
Investors who stayed invested through past drawdowns tend to capture rebounds. J.P. Morgan’s analysis documents this and quantifies the opportunity cost of being out during the best recovery days, as presented in their Staying Invested resource.
Theory aligns with this empirical pattern. The Kleinberg‑Kleinberg‑Oren model quantifies performance gaps that arise from loss‑averse stopping against moving reference points, which maps to the observed tendency to hold losers too long and to miss turnarounds, as shown in their arXiv study of behaviorally biased agents.
Survey evidence adds texture. Overconfidence has been associated with a higher chance of panic selling, and simple literacy does not always correct it. That matters for design — we should add commitment devices to education when building our playbook.
Common misconceptions and counterarguments
“History says X, so do X.” This is a tempting line in corrections. Yet many historical patterns fail basic robustness tests. Practitioners have flagged the danger of data‑mined rules that look great in backtests and fall apart in live markets.
A more careful stance demands an economic story, out‑of‑sample checks, and parsimony. If a rule survives those hurdles, it may deserve a seat in your process. If not, keep it as a hypothesis, not a trigger.
“Education alone fixes behaviour” is another comfortable myth. Training reduces some errors, but confidence can grow faster than skill. That is why advisor interventions, friction, and pre‑commitment matter as much as knowledge in the heat of a sell‑off, a point stressed in practitioner playbooks such as BlackRock’s psychology of investing guidance.
A practical decision‑making framework for corrections
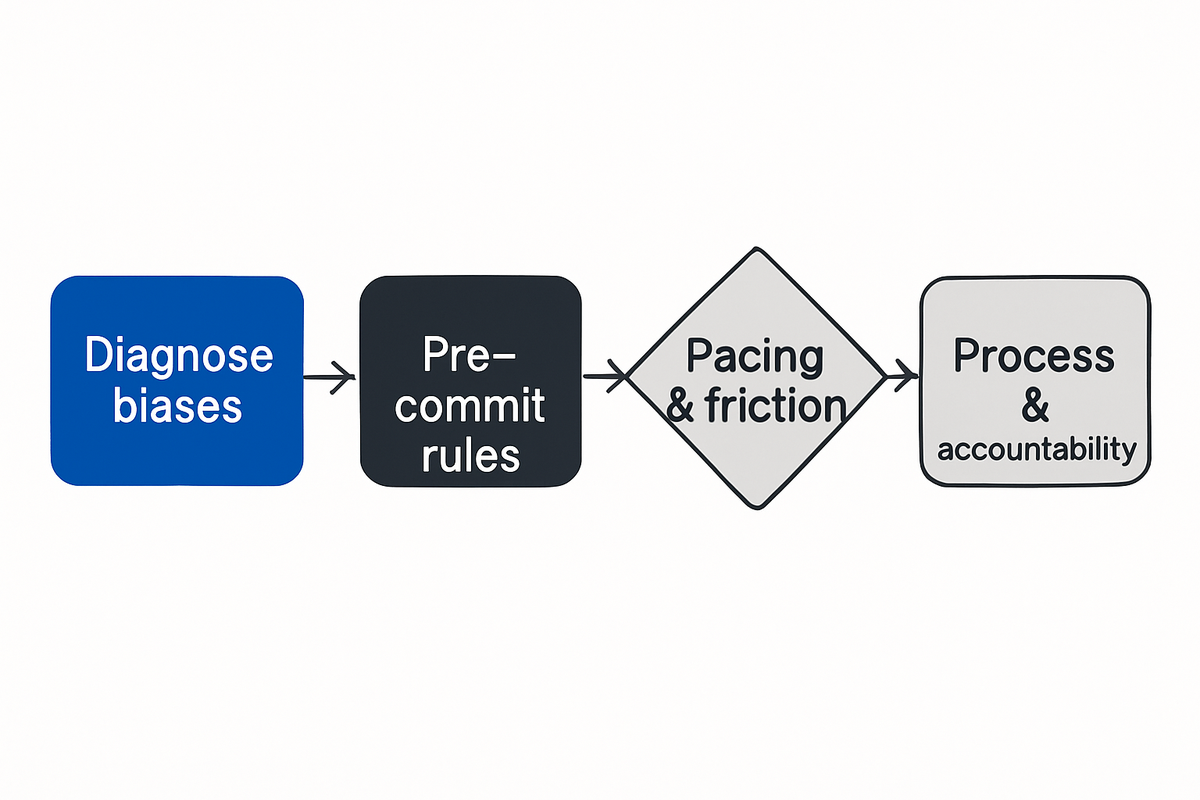
The framework below is layered. Diagnose biases in advance, pre‑commit to actions that limit harm, and build a process that slows herding. It respects how people decide under stress, rather than how models wish they did.
We combine theory and practice. The stopping‑rule insights from Kleinberg‑Kleinberg‑Oren inform thresholds and pacing. Advisor tactics from BlackRock and Morningstar populate the day‑to‑day playbook.
Diagnose and document
Start with a short bias checklist. Mark your likely triggers — recency, loss aversion, confirmation, overconfidence — and the portfolio spots where each is most dangerous.
Run a pre‑mortem. Imagine the next correction and write the story of how you could make three avoidable mistakes. Then design a one‑page response plan for each mistake.
Share the document with a partner or advisor. External eyes raise the cost of inconsistency and reduce the urge to improvise during a drawdown. For a broader context on stress decisions, see our guide to biases in times of market stress.
Pre‑commit and automate
Translate principles into small, concrete rules. Use calendar‑based rebalancing or band‑based rebalancing to move risk back to target when volatility jumps. Phase any necessary de‑risking over several dates.
Calibrate rules to long‑run cost evidence. The J.P. Morgan research on staying invested shows why missing rebounds is expensive, which supports rules that keep core exposure intact while you adjust around the edges, as outlined in their Staying Invested analysis.
Where exit is necessary, pre‑specify. Write down price levels, time windows, and position sizes. That reduces the influence of shifting reference points highlighted in the Kleinberg‑Kleinberg‑Oren stopping model.
Process and accountability
Adopt advisor scripts that slow decisions by 24 to 72 hours in fast markets. Friction increases the chance you check anchor points against your plan. BlackRock’s resources provide plain‑language prompts for this pause.
Add governance to resist herding. Require a quorum for major de‑risking moves during stress, and document rationales against the plan. This simple formality counters the rapid narrative drift seen in synchronized sell‑offs.
Communicate proactively. Explain your rule set to stakeholders before a correction. That shared map reduces second‑guessing when volatility rises. For complementary tactics, see our piece on emotional discipline in investing.
| Bias/Pattern | Trigger in corrections | Risky reaction | Better rule |
|---|---|---|---|
| Loss aversion | Sharp unrealized losses | Hold losers, refuse to rebalance | Pre‑set rebalancing bands and dates |
| Shifting reference point | New low vs. plan benchmark | “Wait to get back to even” | Use plan‑level anchors, not price peaks |
| Recency | Streak of down days | Declare a new regime | Require multi‑horizon evidence before regime changes |
| Confirmation | Selective bearish news | Narrow information sources | Force a “steelman” of the opposite case |
| Disposition effect | Mixed winners and losers | Sell winners, keep losers | Pair trades to trim both sides to targets |
| Overconfidence | Desire to “take control” | All‑in exit, day‑to‑day timing | Phase trades, smaller tickets, cooling‑off periods |
| Herding | Peers de‑risking | Copy trades without thesis | Require independent thesis and pre‑defined triggers |
Check how disciplined your portfolio really is.
Tools, templates and robustness tests
Turn the framework into artefacts. Use a one‑page crisis checklist, a pre‑mortem template, and a rebalancing calculator with fixed bands. Store them where you trade.
Build a “commitment pack.” Include your rule triggers, a script for client or partner calls, and a checklist of narrative red flags. Keep the language short and concrete.
Add robustness guardrails to any historical rule you plan to follow in a correction. Demand an economic rationale, test out of sample, and prefer simple specs. If a rule only works after many tweaks, it is likely data‑mined and should be down‑weighted.
Finally, catalogue accountability. Track every decision made during volatility, with the reason and the rule invoked. Review the log after the event. It reinforces learning and reduces future improvisation.
Conclusion and suggested reading
Corrections do not force bad decisions. Our minds nudge us toward them, and our systems sometimes amplify the nudge. The way out is process over prophecy — pre‑commitment over prediction.
Three anchors help. Respect loss aversion and reference dependence, as formalized in the Kleinberg‑Kleinberg‑Oren model of biased stopping. Remember the historical cost of missing rebounds, as documented by J.P. Morgan’s Staying Invested analysis. Use practitioner checklists to slow you down when screens flash red, such as BlackRock’s psychology of investing guide.
This is not about never selling. It is about selling for reasons that survive a good night’s sleep and a logbook review. For broader context, see our overview of biases during economic uncertainty.
Practice now, not during the next drawdown.
Related reading
- Behavioral Biases in Times of Market Stress: Lessons from Recent Crises
- Emotional Discipline: Strategies to Overcome Cognitive Biases in Investment Decisions
- How Behavioral Biases Affect Decision Making During Economic Uncertainty